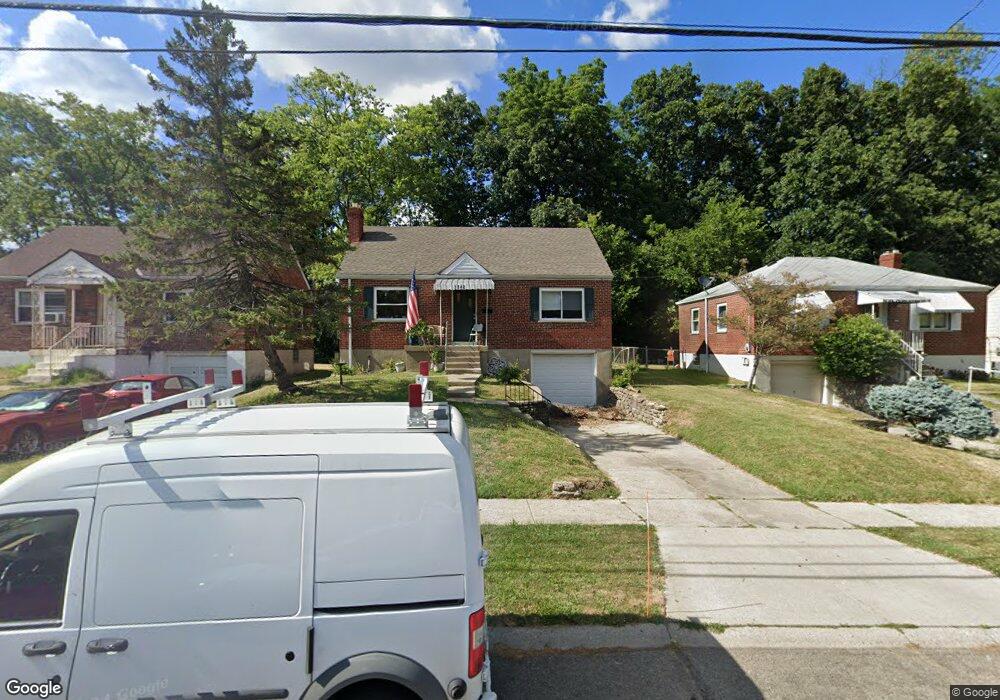
3142 West Tower Ave Cincinnati, OH 45238
Westwood NeighborhoodEstimated Value: $109,000 - $167,574
1
Bed
1
Bath
884
Sq Ft
$166/Sq Ft
Est. Value
About This Home
This home is located at 3142 West Tower Ave, Cincinnati, OH 45238 and is currently estimated at $146,894, approximately $166 per square foot. 3142 West Tower Ave is a home located in Hamilton County with nearby schools including Midway Elementary School, Western Hills High School, and Gilbert A. Dater High School.
Ownership History
Date
Name
Owned For
Owner Type
Purchase Details
Closed on
Aug 11, 2016
Sold by
Houmaidi Karima
Bought by
Vboh Annex Llc
Current Estimated Value
Purchase Details
Closed on
Apr 30, 2010
Sold by
Secretary Of Housing & Urban Development
Bought by
Houmaidi Karima
Home Financials for this Owner
Home Financials are based on the most recent Mortgage that was taken out on this home.
Original Mortgage
$46,403
Interest Rate
5.25%
Mortgage Type
FHA
Purchase Details
Closed on
Oct 19, 2009
Sold by
Amend Troy J
Bought by
Wells Fargo Bank Na
Purchase Details
Closed on
Aug 13, 2009
Sold by
Wells Fargo Bank Na
Bought by
Secretary Of Housing & Urban Development
Purchase Details
Closed on
Dec 26, 2002
Sold by
Louise Amend Elizabeth
Bought by
Amend Troy J and Enderle Lori R
Home Financials for this Owner
Home Financials are based on the most recent Mortgage that was taken out on this home.
Original Mortgage
$87,132
Interest Rate
6.01%
Mortgage Type
FHA
Create a Home Valuation Report for This Property
The Home Valuation Report is an in-depth analysis detailing your home's value as well as a comparison with similar homes in the area
Home Values in the Area
Average Home Value in this Area
Purchase History
| Date | Buyer | Sale Price | Title Company |
|---|---|---|---|
| Vboh Annex Llc | $49,000 | -- | |
| Houmaidi Karima | $50,000 | Attorney | |
| Wells Fargo Bank Na | $54,000 | None Available | |
| Secretary Of Housing & Urban Development | -- | None Available | |
| Amend Troy J | $88,500 | -- |
Source: Public Records
Mortgage History
| Date | Status | Borrower | Loan Amount |
|---|---|---|---|
| Previous Owner | Houmaidi Karima | $46,403 | |
| Previous Owner | Amend Troy J | $87,132 |
Source: Public Records
Tax History Compared to Growth
Tax History
| Year | Tax Paid | Tax Assessment Tax Assessment Total Assessment is a certain percentage of the fair market value that is determined by local assessors to be the total taxable value of land and additions on the property. | Land | Improvement |
|---|---|---|---|---|
| 2024 | $2,592 | $40,786 | $6,542 | $34,244 |
| 2023 | $2,597 | $40,786 | $6,542 | $34,244 |
| 2022 | $1,674 | $23,569 | $5,313 | $18,256 |
| 2021 | $1,642 | $23,569 | $5,313 | $18,256 |
| 2020 | $1,647 | $23,569 | $5,313 | $18,256 |
| 2019 | $1,644 | $21,427 | $4,830 | $16,597 |
| 2018 | $1,646 | $21,427 | $4,830 | $16,597 |
| 2017 | $1,585 | $21,427 | $4,830 | $16,597 |
| 2016 | $1,203 | $16,800 | $5,607 | $11,193 |
| 2015 | $1,085 | $16,800 | $5,607 | $11,193 |
| 2014 | $1,093 | $16,800 | $5,607 | $11,193 |
| 2013 | $1,157 | $17,501 | $5,842 | $11,659 |
Source: Public Records
Map
Nearby Homes
- 3141 W Tower Ave
- 2710 Mountville Dr
- 3020 Veazey Ave
- 3037 N Hegry Cir
- 3032 S Hegry Cir
- 3088 Queen City Ave
- 2925 Boudinot Ave
- 2348 Ferguson Rd
- 3291 Tulsa Ct
- 3007 Ideal Terrace
- 2720 Anderson Ferry Rd
- 2957 Veazey Ave
- 5276 Ponce Ln
- 2936 W Tower Ave
- 3167 Westbrook Dr
- 5252 Relluk Dr
- 3055 Westbrook Dr
- 5038 W High St
- 2914 Queen City Ave
- 3212 Vittmer Ave
- 3142 W Tower Ave
- 3144 W Tower Ave
- 3140 West Tower Ave
- 3144 West Tower Ave
- 3140 W Tower Ave
- 3134 West Tower Ave
- 3152 West Tower Ave
- 3134 W Tower Ave
- 3156 W Towner
- 3156 W Tower Ave
- 3132 West Tower Ave
- 3156 West Tower Ave
- 3132 W Tower Ave
- 3145 West Tower Ave
- 3145 W Tower Ave
- 3149 West Tower Ave
- 3149 W Tower Ave
- 3141 West Tower Ave
- 3133 West Tower Ave
- 3153 West Tower Ave