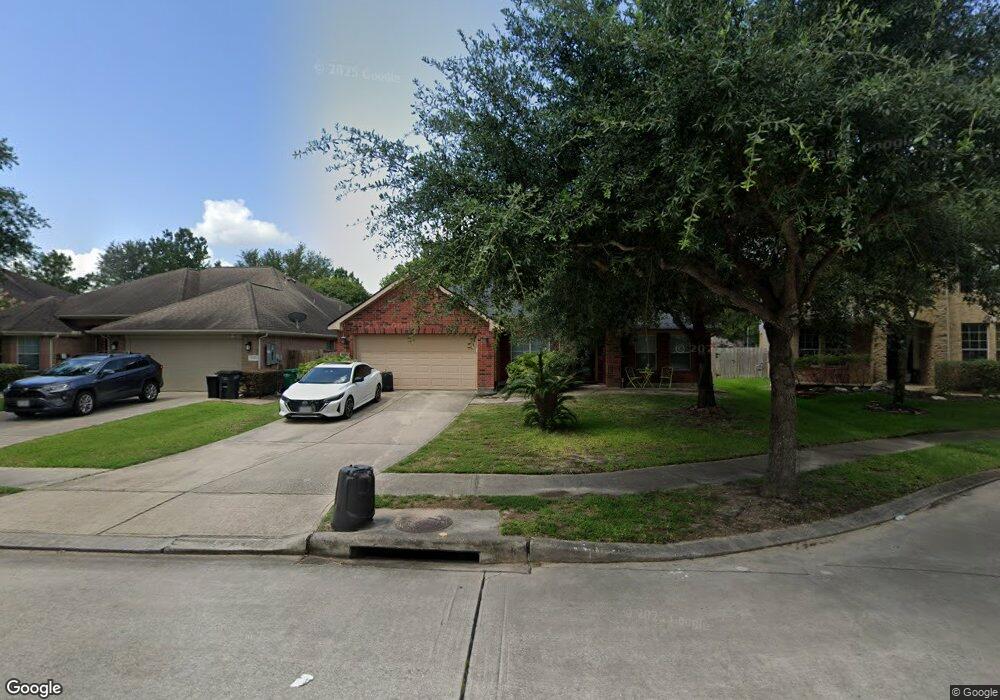
31423 Fountainbrook Park Ln Spring, TX 77386
Imperial Oaks NeighborhoodEstimated Value: $339,905 - $408,000
--
Bed
--
Bath
2,526
Sq Ft
$150/Sq Ft
Est. Value
About This Home
This home is located at 31423 Fountainbrook Park Ln, Spring, TX 77386 and is currently estimated at $377,976, approximately $149 per square foot. 31423 Fountainbrook Park Ln is a home located in Montgomery County with nearby schools including Kaufman Elementary School, Vogel Intermediate School, and Irons J High School.
Ownership History
Date
Name
Owned For
Owner Type
Purchase Details
Closed on
May 20, 2011
Sold by
Acosta Juan A
Bought by
Acosta Juan A and Acosta Teacomsia Annette
Current Estimated Value
Home Financials for this Owner
Home Financials are based on the most recent Mortgage that was taken out on this home.
Original Mortgage
$162,610
Outstanding Balance
$110,759
Interest Rate
4.53%
Mortgage Type
FHA
Estimated Equity
$267,217
Purchase Details
Closed on
Mar 16, 2005
Sold by
Weekley Homes Lp
Bought by
Acosta Juan
Home Financials for this Owner
Home Financials are based on the most recent Mortgage that was taken out on this home.
Original Mortgage
$131,353
Interest Rate
5.66%
Mortgage Type
Purchase Money Mortgage
Purchase Details
Closed on
Sep 8, 2004
Sold by
Imperial Oaks No 3 Ltd
Bought by
Acosta Juan A and Acosta Teacomsia A
Create a Home Valuation Report for This Property
The Home Valuation Report is an in-depth analysis detailing your home's value as well as a comparison with similar homes in the area
Home Values in the Area
Average Home Value in this Area
Purchase History
| Date | Buyer | Sale Price | Title Company |
|---|---|---|---|
| Acosta Juan A | -- | First American Els | |
| Acosta Juan | -- | Priority Title Co | |
| Acosta Juan A | -- | -- |
Source: Public Records
Mortgage History
| Date | Status | Borrower | Loan Amount |
|---|---|---|---|
| Open | Acosta Juan A | $162,610 | |
| Closed | Acosta Juan | $131,353 | |
| Closed | Acosta Juan | $32,838 |
Source: Public Records
Tax History Compared to Growth
Tax History
| Year | Tax Paid | Tax Assessment Tax Assessment Total Assessment is a certain percentage of the fair market value that is determined by local assessors to be the total taxable value of land and additions on the property. | Land | Improvement |
|---|---|---|---|---|
| 2025 | $6,498 | $383,993 | -- | -- |
| 2024 | $5,963 | $349,085 | -- | -- |
| 2023 | $5,963 | $317,350 | $68,000 | $281,540 |
| 2022 | $7,371 | $288,500 | $30,060 | $306,910 |
| 2021 | $7,246 | $262,270 | $30,060 | $232,210 |
| 2020 | $7,587 | $263,070 | $30,060 | $233,010 |
| 2019 | $7,747 | $261,350 | $30,060 | $231,290 |
| 2018 | $6,599 | $247,460 | $30,060 | $217,400 |
| 2017 | $7,378 | $247,460 | $30,060 | $217,400 |
| 2016 | $7,316 | $245,360 | $30,060 | $215,300 |
| 2015 | $5,463 | $208,350 | $30,060 | $187,430 |
| 2014 | $5,463 | $189,410 | $30,060 | $173,260 |
Source: Public Records
Map
Nearby Homes
- 31419 Fountainbrook Park Ln
- 31602 Forest Oak Park Ct
- 2526 Hidden Park Ln
- 31214 Windcrest Park Ln
- 31235 Windcrest Park Ln
- 2618 Bridgestone Park Ln
- 32315 Golden Oak Park Ln
- 32331 Summer Park Ln
- 31815 Forest Oak Ln
- 31810 Forest Oak Ln
- 2614 Winding Creek Way
- 2898 Woodland Glen Ln
- 32319 Archer Park
- 2707 Oak Pass Ct
- 2611 Winding Creek Way
- 31563 Ember Trail Ln
- 32364 Mossy Pine Way
- 31527 Reston Cliff Ct
- 3317 Starlight Hill Ct
- 31030 S Imperial Path Ln
- 31427 Fountainbrook Park Ln
- 31415 Fountainbrook Park Ln
- 2703 Kingsbury Park Ln
- 2710 Kingsbury Park Ln
- 31411 Fountainbrook Park Ln
- 2707 Kingsbury Park Ln
- 31414 Fountainbrook Park Ln
- 2714 Kingsbury Park Ln
- 2711 Kingsbury Park Ln
- 31310 Hilldale Park Ct
- 31410 Fountainbrook Park Ln
- 2718 Kingsbury Park Ln
- 31306 Hilldale Park Ct
- 31314 Hilldale Park Ct
- 31406 Fountainbrook Park Ln
- 2719 Kingsbury Park Ln
- 31250 Quail Oak Park Ln
- 2711 Fountainbrook Park Ct
- 2707 Linden Park Ln
- 2722 Kingsbury Park Ln