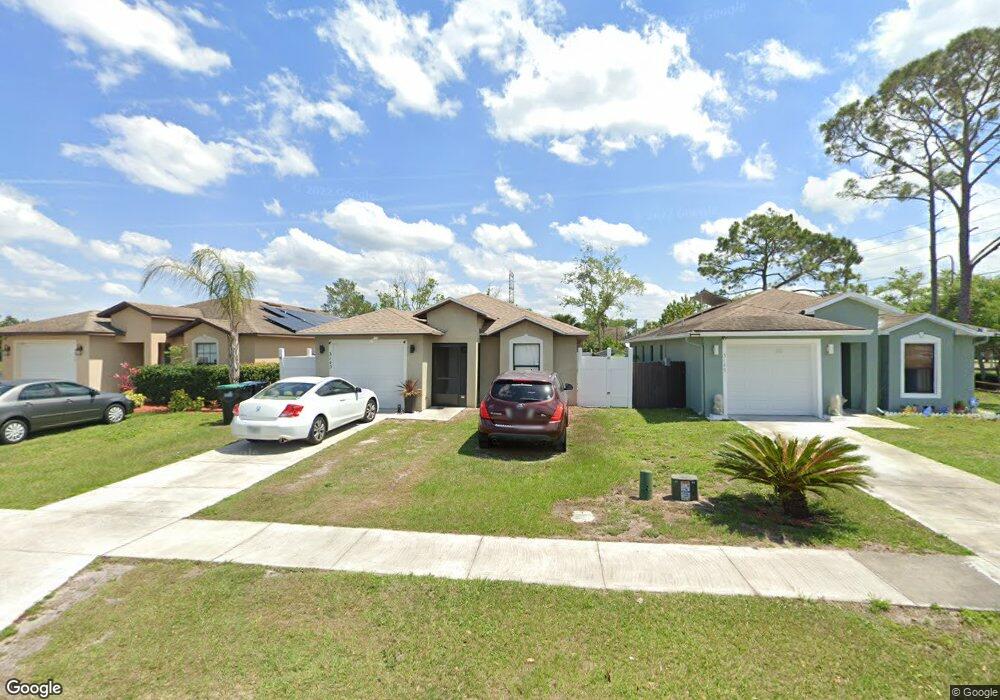
3143 Jon Jon Ct Orlando, FL 32822
South Semoran NeighborhoodEstimated Value: $326,000 - $340,000
3
Beds
2
Baths
1,313
Sq Ft
$254/Sq Ft
Est. Value
About This Home
This home is located at 3143 Jon Jon Ct, Orlando, FL 32822 and is currently estimated at $333,822, approximately $254 per square foot. 3143 Jon Jon Ct is a home located in Orange County with nearby schools including Ventura Elementary School, Roberto Clemente Middle School, and Colonial High School.
Ownership History
Date
Name
Owned For
Owner Type
Purchase Details
Closed on
Nov 28, 2022
Sold by
Cordero Francisco Noel and Cordero Luz Marina
Bought by
Decuba Hubert and Vazquez Mariely
Current Estimated Value
Home Financials for this Owner
Home Financials are based on the most recent Mortgage that was taken out on this home.
Original Mortgage
$314,204
Outstanding Balance
$304,998
Interest Rate
7.08%
Mortgage Type
FHA
Estimated Equity
$28,824
Purchase Details
Closed on
Dec 10, 2018
Sold by
Reyes Juan and Reyes Dalia
Bought by
Cordero Francisco Noel and Cordero Luz Marina
Home Financials for this Owner
Home Financials are based on the most recent Mortgage that was taken out on this home.
Original Mortgage
$205,214
Interest Rate
5.37%
Mortgage Type
FHA
Purchase Details
Closed on
Oct 8, 2009
Sold by
Scaturro Gail
Bought by
Reyes Juan and Reyes Dalia
Purchase Details
Closed on
Mar 24, 2006
Sold by
Garcia Edwin and Garcia Maria P
Bought by
Scaturro Gail
Create a Home Valuation Report for This Property
The Home Valuation Report is an in-depth analysis detailing your home's value as well as a comparison with similar homes in the area
Home Values in the Area
Average Home Value in this Area
Purchase History
| Date | Buyer | Sale Price | Title Company |
|---|---|---|---|
| Decuba Hubert | $320,000 | Fidelity National Title | |
| Cordero Francisco Noel | $209,000 | Fidelity National Title Of F | |
| Reyes Juan | $100,000 | Carrington Title Escrow I | |
| Scaturro Gail | $63,400 | -- |
Source: Public Records
Mortgage History
| Date | Status | Borrower | Loan Amount |
|---|---|---|---|
| Open | Decuba Hubert | $314,204 | |
| Previous Owner | Cordero Francisco Noel | $205,214 |
Source: Public Records
Tax History Compared to Growth
Tax History
| Year | Tax Paid | Tax Assessment Tax Assessment Total Assessment is a certain percentage of the fair market value that is determined by local assessors to be the total taxable value of land and additions on the property. | Land | Improvement |
|---|---|---|---|---|
| 2025 | $4,343 | $291,220 | -- | -- |
| 2024 | $4,055 | $291,220 | -- | -- |
| 2023 | $4,055 | $274,770 | $75,000 | $199,770 |
| 2022 | $2,381 | $168,479 | $0 | $0 |
| 2021 | $2,336 | $163,572 | $0 | $0 |
| 2020 | $2,213 | $161,314 | $0 | $0 |
| 2019 | $2,267 | $157,687 | $35,000 | $122,687 |
| 2018 | $2,312 | $120,285 | $26,250 | $94,035 |
| 2017 | $2,280 | $117,794 | $26,250 | $91,544 |
| 2016 | $2,193 | $113,978 | $25,250 | $88,728 |
| 2015 | $2,108 | $109,066 | $25,000 | $84,066 |
| 2014 | $1,927 | $90,232 | $9,500 | $80,732 |
Source: Public Records
Map
Nearby Homes
- 3017 Jon Ct
- 4135 Mau Ln Unit 377
- 4124 Mau Ln Unit 435
- 4119 Mau Ln Unit 369
- 4117 Mau Ln Unit 368
- 4288 Hibiscus Bloom Dr
- 3772 Ventura Cove Dr
- 7311 Mai Tai Dr Unit 316
- 6978 Mediterranean Rd
- 3101 S Goldenrod Rd
- 3106 S Goldenrod Rd
- 7319 Kaha St
- 7331 Kaha St Unit 358
- 6250 Pershing Ave
- 6961 Gibraltar Rd
- 3900 Southpointe Dr Unit 127
- 2726 Ranch House Rd Unit 89
- 2721 Appaloosa Rd
- 6937 Gibraltar Rd
- 7502 Thelma Way Unit 1
- 3145 Jon Ct
- 3145 Jon Jon Ct
- 3141 Jon Jon Ct
- 7185 Pershing Ave
- 3142 Jon Jon Ct
- 3140 Jon Jon Ct
- 3144 Jon Jon Ct
- 3134 Jon Jon Ct
- 3132 Jon Jon Ct
- 3201 Jon Jon Dr
- 3130 Jon Jon Ct
- 3128 Jon Jon Ct
- 3120 Jon Jon Ct
- 3206 Bo Jeremy Dr
- 3118 Jon Ct
- 3209 Jon Jon Dr
- 3118 Jon Jon Ct
- 3214 Bo Jeremy Dr
- 3116 Jon Jon Ct