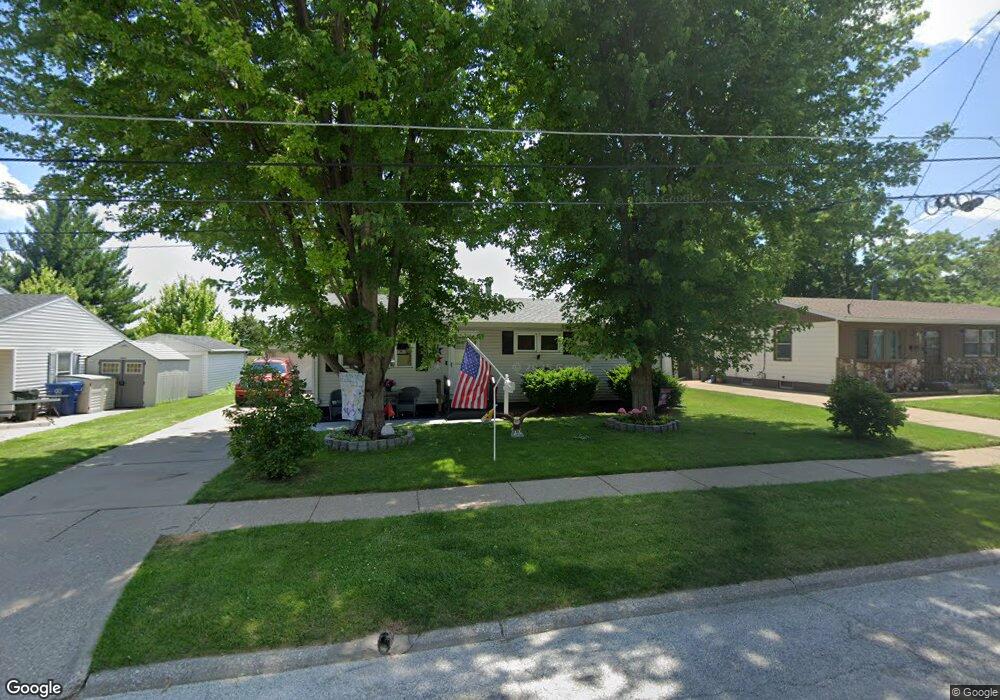
3143 W 2nd St Davenport, IA 52804
West End NeighborhoodEstimated Value: $138,000 - $158,000
3
Beds
3
Baths
960
Sq Ft
$152/Sq Ft
Est. Value
About This Home
This home is located at 3143 W 2nd St, Davenport, IA 52804 and is currently estimated at $145,919, approximately $151 per square foot. 3143 W 2nd St is a home located in Scott County with nearby schools including Walnut Hill Elementary School, Jackson Elementary School, and Frank L. Smart Intermediate School.
Ownership History
Date
Name
Owned For
Owner Type
Purchase Details
Closed on
May 25, 2022
Sold by
Burton Robert D and Burton Debra A
Bought by
Kennedy Nancy J
Current Estimated Value
Home Financials for this Owner
Home Financials are based on the most recent Mortgage that was taken out on this home.
Original Mortgage
$33,520
Outstanding Balance
$27,692
Interest Rate
4.38%
Mortgage Type
New Conventional
Estimated Equity
$118,227
Purchase Details
Closed on
Dec 17, 2010
Sold by
Parris Theresa A and Mccosley Jeanne E
Bought by
Burton Robert D and Burton Debra A
Home Financials for this Owner
Home Financials are based on the most recent Mortgage that was taken out on this home.
Original Mortgage
$72,000
Interest Rate
4.44%
Mortgage Type
New Conventional
Create a Home Valuation Report for This Property
The Home Valuation Report is an in-depth analysis detailing your home's value as well as a comparison with similar homes in the area
Home Values in the Area
Average Home Value in this Area
Purchase History
| Date | Buyer | Sale Price | Title Company |
|---|---|---|---|
| Kennedy Nancy J | $42,000 | None Listed On Document | |
| Burton Robert D | $90,000 | None Available |
Source: Public Records
Mortgage History
| Date | Status | Borrower | Loan Amount |
|---|---|---|---|
| Open | Kennedy Nancy J | $33,520 | |
| Previous Owner | Burton Robert D | $72,000 |
Source: Public Records
Tax History Compared to Growth
Tax History
| Year | Tax Paid | Tax Assessment Tax Assessment Total Assessment is a certain percentage of the fair market value that is determined by local assessors to be the total taxable value of land and additions on the property. | Land | Improvement |
|---|---|---|---|---|
| 2025 | $2,288 | $142,470 | $19,500 | $122,970 |
| 2024 | $2,232 | $128,000 | $19,500 | $108,500 |
| 2023 | $2,302 | $128,000 | $19,500 | $108,500 |
| 2022 | $2,312 | $107,780 | $17,880 | $89,900 |
| 2021 | $2,312 | $107,780 | $17,880 | $89,900 |
| 2020 | $2,288 | $105,280 | $17,880 | $87,400 |
| 2019 | $2,176 | $96,960 | $17,880 | $79,080 |
| 2018 | $2,042 | $96,960 | $17,880 | $79,080 |
| 2017 | $2,114 | $93,000 | $17,880 | $75,120 |
| 2016 | $2,036 | $93,000 | $0 | $0 |
| 2015 | $2,036 | $92,970 | $0 | $0 |
| 2014 | $2,064 | $92,970 | $0 | $0 |
| 2013 | $2,030 | $0 | $0 | $0 |
| 2012 | -- | $86,160 | $15,080 | $71,080 |
Source: Public Records
Map
Nearby Homes