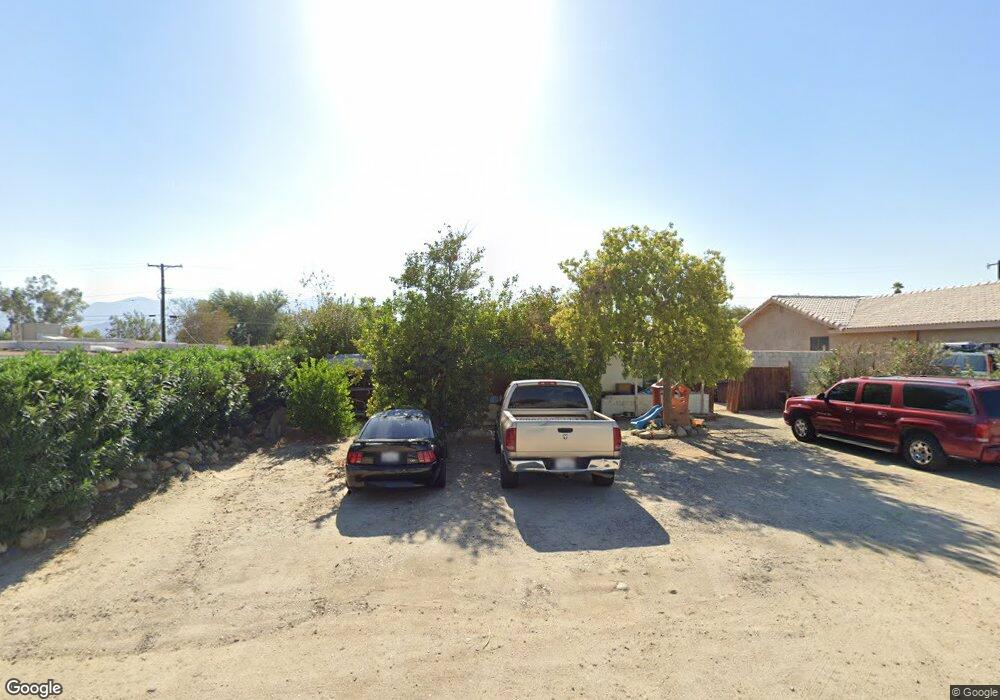
31431 Las Flores Way Thousand Palms, CA 92276
Estimated Value: $184,000 - $329,000
2
Beds
1
Bath
940
Sq Ft
$274/Sq Ft
Est. Value
About This Home
This home is located at 31431 Las Flores Way, Thousand Palms, CA 92276 and is currently estimated at $257,439, approximately $273 per square foot. 31431 Las Flores Way is a home located in Riverside County with nearby schools including Della S. Lindley Elementary School, Nellie N. Coffman Middle School, and Rancho Mirage High.
Ownership History
Date
Name
Owned For
Owner Type
Purchase Details
Closed on
Oct 4, 2005
Sold by
Dela Paz Julita
Bought by
Dela Paz Julita
Current Estimated Value
Home Financials for this Owner
Home Financials are based on the most recent Mortgage that was taken out on this home.
Original Mortgage
$97,500
Outstanding Balance
$62,219
Interest Rate
8.99%
Mortgage Type
Stand Alone Refi Refinance Of Original Loan
Estimated Equity
$195,220
Purchase Details
Closed on
May 3, 2004
Sold by
Hiscutt Loren David
Bought by
Delapaz Julita
Purchase Details
Closed on
Apr 29, 2004
Sold by
Delapaz Roberto and Delapaz Maria
Bought by
Delapaz Julita
Purchase Details
Closed on
Jan 14, 1999
Sold by
Draeger Dorothy Trust and Richard
Bought by
Delapaz Roberto and Delapaz Maria
Home Financials for this Owner
Home Financials are based on the most recent Mortgage that was taken out on this home.
Original Mortgage
$54,915
Interest Rate
6.77%
Mortgage Type
FHA
Create a Home Valuation Report for This Property
The Home Valuation Report is an in-depth analysis detailing your home's value as well as a comparison with similar homes in the area
Home Values in the Area
Average Home Value in this Area
Purchase History
| Date | Buyer | Sale Price | Title Company |
|---|---|---|---|
| Dela Paz Julita | -- | Fidelity National Financial | |
| Delapaz Julita | -- | -- | |
| Delapaz Julita | -- | -- | |
| Delapaz Roberto | $55,000 | Lawyers Title Company |
Source: Public Records
Mortgage History
| Date | Status | Borrower | Loan Amount |
|---|---|---|---|
| Open | Dela Paz Julita | $97,500 | |
| Previous Owner | Delapaz Roberto | $54,915 |
Source: Public Records
Tax History Compared to Growth
Tax History
| Year | Tax Paid | Tax Assessment Tax Assessment Total Assessment is a certain percentage of the fair market value that is determined by local assessors to be the total taxable value of land and additions on the property. | Land | Improvement |
|---|---|---|---|---|
| 2025 | $3,564 | $86,188 | $21,539 | $64,649 |
| 2023 | $3,564 | $82,843 | $20,703 | $62,140 |
| 2022 | $3,546 | $81,220 | $20,298 | $60,922 |
| 2021 | $3,521 | $79,628 | $19,900 | $59,728 |
| 2020 | $3,464 | $78,812 | $19,696 | $59,116 |
| 2019 | $3,442 | $77,267 | $19,310 | $57,957 |
| 2018 | $3,424 | $75,753 | $18,932 | $56,821 |
| 2017 | $3,408 | $74,268 | $18,561 | $55,707 |
| 2016 | $3,378 | $72,813 | $18,198 | $54,615 |
| 2015 | $1,815 | $71,722 | $17,926 | $53,796 |
| 2014 | $1,789 | $70,320 | $17,576 | $52,744 |
Source: Public Records
Map
Nearby Homes
- 31163 Arbol Real Ave
- 12345 Ramon Rd
- 30905 Calle Jessica
- 32080 Westchester Dr
- 32121 Oakland Hills St
- 32060 Oakland Hills
- 31112 Via Pared
- 32081 San Miguelito Dr
- 30621 Arbol Real
- 33860 33860 Callita Bell
- 32222 Cody Ave
- 73250 Colonial Dr
- 73270 Colonial Dr
- 0 Cody Ave
- 73301 Colonial Dr
- 73257 Quivera St
- 32520 Westchester Dr
- 32523 Flagstaff Ave
- 32585 Saint Andrews Dr
- 32380 San Miguelito Dr
- 31453 Las Flores Way
- 31419 Las Flores Way
- 31420 Arbol Real
- 31401 Las Flores Way Unit 2
- 31400 Arbol Real
- 31450 Arbol Real
- 31373 Las Flores Way
- 31380 Arbol Real
- 31430 Las Flores Way
- 31480 Arbol Real
- 31456 Las Flores Way
- 0 La Canada Way Unit 217006228DA
- 0 La Canada Way Unit 219087444DA
- 0 La Canada Way Unit 218006746DA
- 0 La Canada Way Unit 219006295DA
- 0 La Canada Way Unit 219078761DA
- 0 La Canada Way Unit 219057388
- 0 La Canada Way Unit 219047578
- 0 La Canada Way Unit 219040027
- 0 La Canada Way Unit 214083785