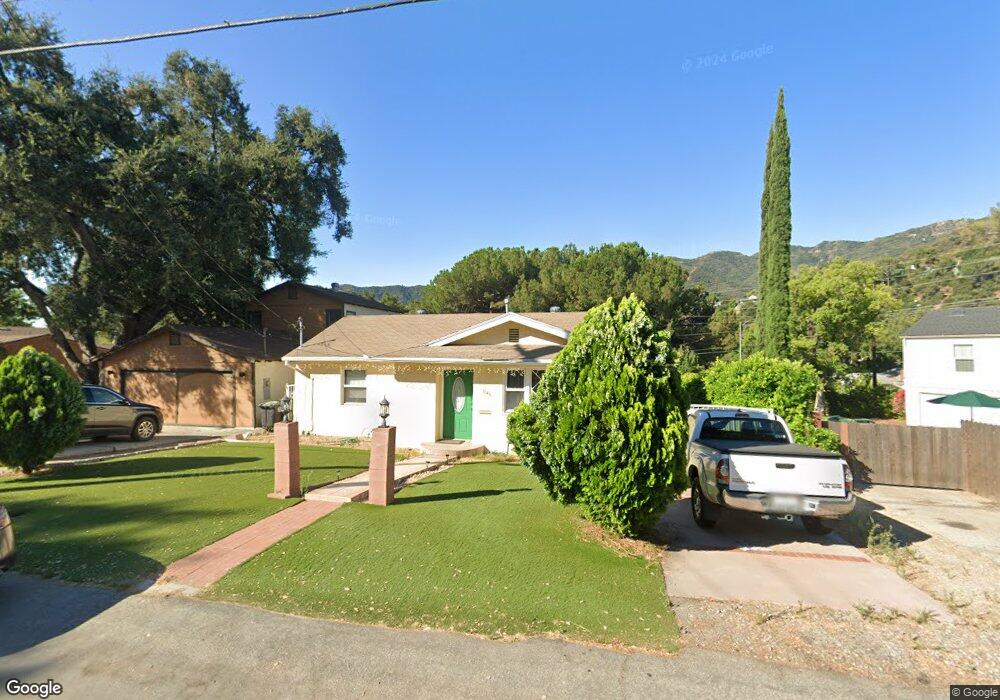
3146 Mills Ave La Crescenta, CA 91214
Estimated Value: $1,001,443 - $1,119,000
2
Beds
2
Baths
1,074
Sq Ft
$989/Sq Ft
Est. Value
About This Home
This home is located at 3146 Mills Ave, La Crescenta, CA 91214 and is currently estimated at $1,061,861, approximately $988 per square foot. 3146 Mills Ave is a home located in Los Angeles County with nearby schools including Abraham Lincoln Elementary School, Rosemont Middle School, and Crescenta Valley High School.
Ownership History
Date
Name
Owned For
Owner Type
Purchase Details
Closed on
Feb 23, 2005
Sold by
Zarifian Armen and Zarifian Shakeh
Bought by
Petrosian Saro
Current Estimated Value
Home Financials for this Owner
Home Financials are based on the most recent Mortgage that was taken out on this home.
Original Mortgage
$468,000
Outstanding Balance
$219,158
Interest Rate
4.47%
Mortgage Type
Negative Amortization
Estimated Equity
$842,703
Purchase Details
Closed on
Aug 20, 2002
Sold by
Zarifian Armen and Zarifian Shakeh
Bought by
Zarifian Armen
Purchase Details
Closed on
Jul 30, 1998
Sold by
Wilhelm Trust and Roger
Bought by
Zarifian Armen
Home Financials for this Owner
Home Financials are based on the most recent Mortgage that was taken out on this home.
Original Mortgage
$143,250
Interest Rate
6.91%
Create a Home Valuation Report for This Property
The Home Valuation Report is an in-depth analysis detailing your home's value as well as a comparison with similar homes in the area
Home Values in the Area
Average Home Value in this Area
Purchase History
| Date | Buyer | Sale Price | Title Company |
|---|---|---|---|
| Petrosian Saro | $585,000 | Southland Title | |
| Zarifian Armen | -- | -- | |
| Zarifian Armen | $191,000 | Gateway Title Company |
Source: Public Records
Mortgage History
| Date | Status | Borrower | Loan Amount |
|---|---|---|---|
| Open | Petrosian Saro | $468,000 | |
| Previous Owner | Zarifian Armen | $143,250 | |
| Closed | Zarifian Armen | $38,200 |
Source: Public Records
Tax History
| Year | Tax Paid | Tax Assessment Tax Assessment Total Assessment is a certain percentage of the fair market value that is determined by local assessors to be the total taxable value of land and additions on the property. | Land | Improvement |
|---|---|---|---|---|
| 2025 | $9,100 | $815,422 | $652,345 | $163,077 |
| 2024 | $9,100 | $799,434 | $639,554 | $159,880 |
| 2023 | $8,898 | $783,760 | $627,014 | $156,746 |
| 2022 | $8,552 | $768,393 | $614,720 | $153,673 |
| 2021 | $8,410 | $753,327 | $602,667 | $150,660 |
| 2019 | $8,089 | $730,986 | $584,793 | $146,193 |
| 2018 | $7,469 | $677,000 | $542,000 | $135,000 |
| 2016 | $7,137 | $651,000 | $521,300 | $129,700 |
| 2015 | $5,763 | $527,000 | $422,000 | $105,000 |
| 2014 | $5,827 | $527,000 | $422,000 | $105,000 |
Source: Public Records
Map
Nearby Homes
- 3130 Montrose Ave Unit 102
- 3010 Montrose Ave Unit 33
- 21 Northwoods Ln
- 2944 Mayfield Ave
- 2905 Montrose Ave Unit 610
- 2900 Fairway Ave Unit 507
- 2817 Montrose Ave
- 0 Mountain Oaks Park
- 2806 Manhattan Ave
- 2727 Altura Ave
- 2700 Prospect Ave
- 4208 New York Ave
- 4608 La Crescenta Ave
- 3033 Fairesta St
- 2442 Cross St
- 3456 Altura Ave
- 3908 Park Place
- 2758 El Caminito
- 2434 Prospect Ave
- 2902 El Caminito
- 3142 Mills Ave
- 3158 Mills Ave
- 3918 Pennsylvania Ave
- 3138 Mills Ave
- 3132 Mills Ave
- 3147 Mills Ave
- 3143 Mills Ave
- 3151 Mills Ave
- 3135 Mills Ave
- 3157 Mills Ave
- 3128 Mills Ave
- 3915 Pennsylvania Ave
- 3921 Pennsylvania Ave
- 3161 Hermosa Ave
- 3131 Mills Ave
- 4019 Liberty Ave
- 3923 Pennsylvania Ave
- 3205 Park Vista Dr
- 3938 Pennsylvania Ave
- 3935 Pennsylvania Ave
Your Personal Tour Guide
Ask me questions while you tour the home.