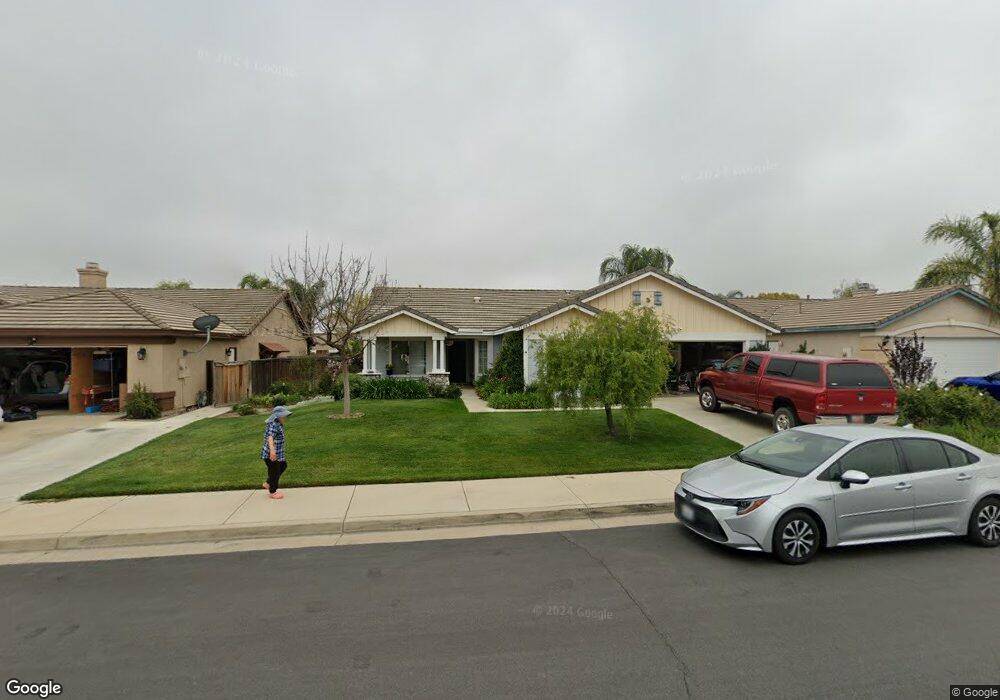
31463 Bonn Ct Winchester, CA 92596
Estimated Value: $574,838 - $608,000
3
Beds
2
Baths
1,685
Sq Ft
$352/Sq Ft
Est. Value
About This Home
This home is located at 31463 Bonn Ct, Winchester, CA 92596 and is currently estimated at $593,710, approximately $352 per square foot. 31463 Bonn Ct is a home located in Riverside County with nearby schools including French Valley Elementary School, Bella Vista Middle School, and Chaparral High School.
Ownership History
Date
Name
Owned For
Owner Type
Purchase Details
Closed on
Apr 16, 2013
Sold by
Gordon Alvan B and Gordon Katherine J
Bought by
Gordon Alvan Bruce and Gordon Katherine Jean
Current Estimated Value
Home Financials for this Owner
Home Financials are based on the most recent Mortgage that was taken out on this home.
Original Mortgage
$206,170
Outstanding Balance
$146,382
Interest Rate
3.6%
Mortgage Type
New Conventional
Estimated Equity
$447,328
Purchase Details
Closed on
Nov 6, 2006
Sold by
Gordon Alvan Bruce and Gordon Katherine Jean
Bought by
Gordon Alvan Bruce and Gordon Katherine Jean
Purchase Details
Closed on
May 4, 2000
Sold by
The Forecast Group Lp
Bought by
Gordon Alvan B and Gordon Katherine J
Home Financials for this Owner
Home Financials are based on the most recent Mortgage that was taken out on this home.
Original Mortgage
$133,592
Interest Rate
8.67%
Mortgage Type
Stand Alone First
Create a Home Valuation Report for This Property
The Home Valuation Report is an in-depth analysis detailing your home's value as well as a comparison with similar homes in the area
Home Values in the Area
Average Home Value in this Area
Purchase History
| Date | Buyer | Sale Price | Title Company |
|---|---|---|---|
| Gordon Alvan Bruce | -- | Westminster Title Company | |
| Gordon Alvan B | -- | Westminster Title Company | |
| Gordon Alvan Bruce | -- | None Available | |
| Gordon Alvan B | $167,000 | Orange Coast Title |
Source: Public Records
Mortgage History
| Date | Status | Borrower | Loan Amount |
|---|---|---|---|
| Open | Gordon Alvan B | $206,170 | |
| Previous Owner | Gordon Alvan B | $133,592 | |
| Closed | Gordon Alvan B | $25,048 |
Source: Public Records
Tax History Compared to Growth
Tax History
| Year | Tax Paid | Tax Assessment Tax Assessment Total Assessment is a certain percentage of the fair market value that is determined by local assessors to be the total taxable value of land and additions on the property. | Land | Improvement |
|---|---|---|---|---|
| 2025 | $2,634 | $256,640 | $61,460 | $195,180 |
| 2023 | $2,634 | $246,675 | $59,074 | $187,601 |
| 2022 | $2,560 | $241,839 | $57,916 | $183,923 |
| 2021 | $2,510 | $237,098 | $56,781 | $180,317 |
| 2020 | $4,357 | $234,668 | $56,199 | $178,469 |
| 2019 | $4,328 | $230,068 | $55,098 | $174,970 |
| 2018 | $4,278 | $225,558 | $54,019 | $171,539 |
| 2017 | $4,217 | $221,136 | $52,960 | $168,176 |
| 2016 | $4,169 | $216,801 | $51,922 | $164,879 |
| 2015 | $4,137 | $213,546 | $51,143 | $162,403 |
| 2014 | $4,071 | $209,366 | $50,143 | $159,223 |
Source: Public Records
Map
Nearby Homes
- 36423 Rotterdam St
- 31556 Umbria Ln
- 31572 Adour Way
- 31431 Bradford St
- 31659 Poppy St
- 31759 Delfina Way
- 31771 Biagio Way
- 36315 Antoinette Ln
- 36358 Matino Ln
- 31796 Gimbal Way
- 36045 Glasgow St
- 36316 Cosimo Ln
- 36355 Amerigo Ln
- 36316 Grazia Way Unit 167
- 36320 Grazia Way
- 31809 Delfina Way
- 36362 Arcs St
- 36415 Flare Dr
- 31369 Frans Hals Dr
- 36918 Blanc Ct