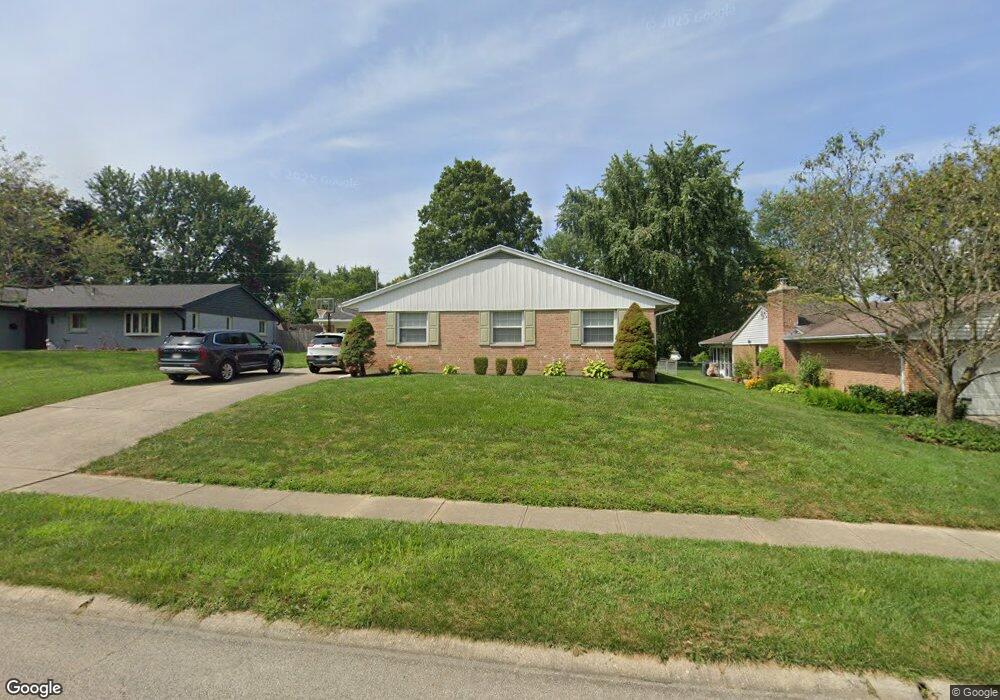
3147 Sandywood Dr Dayton, OH 45440
Estimated Value: $284,000 - $311,000
4
Beds
2
Baths
1,854
Sq Ft
$159/Sq Ft
Est. Value
About This Home
This home is located at 3147 Sandywood Dr, Dayton, OH 45440 and is currently estimated at $294,464, approximately $158 per square foot. 3147 Sandywood Dr is a home located in Montgomery County with nearby schools including Prass Elementary School, Kettering Middle School, and Kettering Fairmont High School.
Ownership History
Date
Name
Owned For
Owner Type
Purchase Details
Closed on
Jul 17, 2025
Sold by
Morton Property Group Llc
Bought by
3147 Sandywood Llc
Current Estimated Value
Purchase Details
Closed on
Dec 6, 2020
Sold by
Morton Michael E and Morton Lynette M
Bought by
Morton Property Group Llc
Purchase Details
Closed on
Oct 4, 2019
Sold by
Charles Agnor Jr and Charles Lisa Ward
Bought by
Morton Michael
Home Financials for this Owner
Home Financials are based on the most recent Mortgage that was taken out on this home.
Original Mortgage
$97,105
Interest Rate
3.6%
Mortgage Type
New Conventional
Purchase Details
Closed on
Mar 7, 2017
Sold by
Estate Of Charles Leon Agnore Sr
Bought by
Agnor Charles and Ward Lisa
Purchase Details
Closed on
Apr 18, 2008
Sold by
Estate Of Loretta Agnor
Bought by
Agnor Charles L
Create a Home Valuation Report for This Property
The Home Valuation Report is an in-depth analysis detailing your home's value as well as a comparison with similar homes in the area
Home Values in the Area
Average Home Value in this Area
Purchase History
| Date | Buyer | Sale Price | Title Company |
|---|---|---|---|
| 3147 Sandywood Llc | -- | None Listed On Document | |
| Morton Property Group Llc | -- | Fidelity Lawyers Ttl Agcy Ll | |
| Morton Michael | $137,200 | Sterling Land Title Agcy Inc | |
| Agnor Charles | -- | None Available | |
| Agnor Charles L | -- | None Available |
Source: Public Records
Mortgage History
| Date | Status | Borrower | Loan Amount |
|---|---|---|---|
| Previous Owner | Morton Michael | $97,105 |
Source: Public Records
Tax History Compared to Growth
Tax History
| Year | Tax Paid | Tax Assessment Tax Assessment Total Assessment is a certain percentage of the fair market value that is determined by local assessors to be the total taxable value of land and additions on the property. | Land | Improvement |
|---|---|---|---|---|
| 2024 | $5,165 | $81,640 | $12,760 | $68,880 |
| 2023 | $5,165 | $81,640 | $12,760 | $68,880 |
| 2022 | $5,203 | $65,080 | $10,210 | $54,870 |
| 2021 | $4,820 | $65,080 | $10,210 | $54,870 |
| 2020 | $4,835 | $65,080 | $10,210 | $54,870 |
| 2019 | $4,439 | $52,830 | $10,210 | $42,620 |
| 2018 | $4,463 | $52,830 | $10,210 | $42,620 |
| 2017 | $4,171 | $52,830 | $10,210 | $42,620 |
| 2016 | $3,021 | $45,980 | $10,210 | $35,770 |
| 2015 | $2,886 | $45,980 | $10,210 | $35,770 |
| 2014 | $2,886 | $45,980 | $10,210 | $35,770 |
| 2012 | -- | $43,770 | $10,190 | $33,580 |
Source: Public Records
Map
Nearby Homes
- 861 Acorn Dr
- 3034 Sandywood Dr
- 3117 Swigert Rd
- 2816 Corlington Dr
- 2841 Corlington Dr
- 4227 Wagner Rd
- 2648 Parklawn Dr
- 470 Cloverhill Ct
- 4533 Drayton Ct
- 4408 Glenheath Dr
- 4901 Wilmington Pike
- 4824 Rean Meadow Dr
- 4464 Woodner Dr
- 2447 Hemphill Rd
- 3033 Glenmere Ct
- 2409 Burning Tree Dr
- 2579 Walford Dr
- 4489 Bucksport Ct
- 4086 Glenheath Dr
- 4708 Elzo Ln
- 3155 Sandywood Dr
- 3139 Sandywood Dr
- 3009 Sandywood Dr
- 3131 Sandywood Dr
- 4500 Timberwilde Dr
- 4508 Timberwilde Dr
- 3001 Sandywood Dr
- 3017 Sandywood Dr
- 858 Acorn Dr
- 851 Acorn Dr
- 3902 Oak Creek Dr
- 904 Acorn Dr
- 868 Acorn Dr
- 828 Acorn Dr
- 848 Acorn Dr
- 912 Acorn Dr
- 833 Acorn Dr
- 894 Acorn Dr
- 976 Acorn Dr
- 958 Acorn Dr