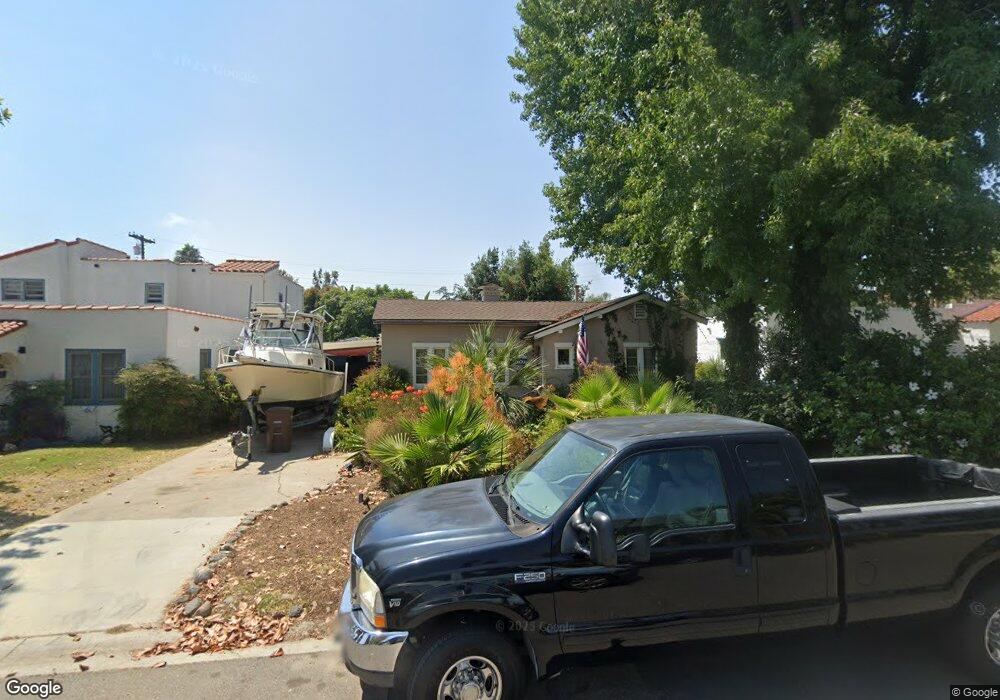
31471 La Matanza St San Juan Capistrano, CA 92675
Estimated Value: $983,000 - $1,262,000
3
Beds
1
Bath
1,168
Sq Ft
$944/Sq Ft
Est. Value
About This Home
This home is located at 31471 La Matanza St, San Juan Capistrano, CA 92675 and is currently estimated at $1,102,583, approximately $943 per square foot. 31471 La Matanza St is a home located in Orange County with nearby schools including San Juan Elementary School, Marco Forster Middle School, and San Juan Hills High School.
Ownership History
Date
Name
Owned For
Owner Type
Purchase Details
Closed on
Mar 2, 2000
Sold by
Shaughnessy Thomas E and Shaugnessy Marie D
Bought by
Mankawich Joseph C
Current Estimated Value
Home Financials for this Owner
Home Financials are based on the most recent Mortgage that was taken out on this home.
Original Mortgage
$211,760
Outstanding Balance
$70,269
Interest Rate
8%
Estimated Equity
$1,032,314
Purchase Details
Closed on
Sep 22, 1999
Sold by
Mcguire Mark R and Sisca Carla Sisca
Bought by
Shaughnessy Thomas E and Shaughnessy Marie D
Home Financials for this Owner
Home Financials are based on the most recent Mortgage that was taken out on this home.
Original Mortgage
$147,700
Interest Rate
7.86%
Create a Home Valuation Report for This Property
The Home Valuation Report is an in-depth analysis detailing your home's value as well as a comparison with similar homes in the area
Home Values in the Area
Average Home Value in this Area
Purchase History
| Date | Buyer | Sale Price | Title Company |
|---|---|---|---|
| Mankawich Joseph C | $265,000 | First American Title Ins Co | |
| Shaughnessy Thomas E | $253,500 | First American Title Ins Co |
Source: Public Records
Mortgage History
| Date | Status | Borrower | Loan Amount |
|---|---|---|---|
| Open | Mankawich Joseph C | $211,760 | |
| Previous Owner | Shaughnessy Thomas E | $147,700 | |
| Closed | Shaughnessy Thomas E | $55,000 | |
| Closed | Mankawich Joseph C | $26,470 |
Source: Public Records
Tax History Compared to Growth
Tax History
| Year | Tax Paid | Tax Assessment Tax Assessment Total Assessment is a certain percentage of the fair market value that is determined by local assessors to be the total taxable value of land and additions on the property. | Land | Improvement |
|---|---|---|---|---|
| 2025 | $4,395 | $406,823 | $367,069 | $39,754 |
| 2024 | $4,395 | $398,847 | $359,872 | $38,975 |
| 2023 | $4,245 | $391,027 | $352,816 | $38,211 |
| 2022 | $3,895 | $383,360 | $345,898 | $37,462 |
| 2021 | $3,822 | $375,844 | $339,116 | $36,728 |
| 2020 | $3,788 | $371,991 | $335,639 | $36,352 |
| 2019 | $3,716 | $364,698 | $329,058 | $35,640 |
| 2018 | $3,648 | $357,548 | $322,606 | $34,942 |
| 2017 | $3,613 | $350,538 | $316,281 | $34,257 |
| 2016 | $3,546 | $343,665 | $310,079 | $33,586 |
| 2015 | $3,491 | $338,503 | $305,421 | $33,082 |
| 2014 | $3,427 | $331,873 | $299,439 | $32,434 |
Source: Public Records
Map
Nearby Homes
- 31608 Los Rios St Unit 147
- 31261 Paseo Olivos
- 31377 Los Rios St Unit 64
- 31284 Calle San Juan Unit 14
- 31278 Calle San Juan Unit 12
- 27381 Via Priorato
- 31121 Via Santo Tomas
- 26468 Calle San Antonio
- 30981 Via Mirador
- 26447 Paseo Carmel Unit 11D
- 0 Aguacate Rd Unit 25558127
- 31980 Via Refrescar
- 31024 Calle San Diego Unit 94b
- 32024 Paseo Rama
- 32011 Via Tonada Unit 9
- 31527 Aguacate Rd
- 30828 Calle Chueca
- 27594 Starrise Ln
- 90 Plaza de Las Flores
- 32001 Via Canela
- 31481 La Matanza St
- 31451 La Matanza St
- 31501 La Matanza St
- 26821 Acjachema St
- 31462 La Matanza St Unit B back
- 31482 La Matanza St
- 31472 La Matanza St
- 31492 La Matanza St
- 26811 Acjachema St
- 31452 La Matanza St
- 31502 La Matanza St
- 31442 La Matanza St
- 31432 La Matanza St
- 31502 El Camino Real
- 31481 La Calera St
- 31471 La Calera St
- 31491 La Calera St
- 31461 La Calera St
- 31422 La Matanza St
- 31451 La Calera St