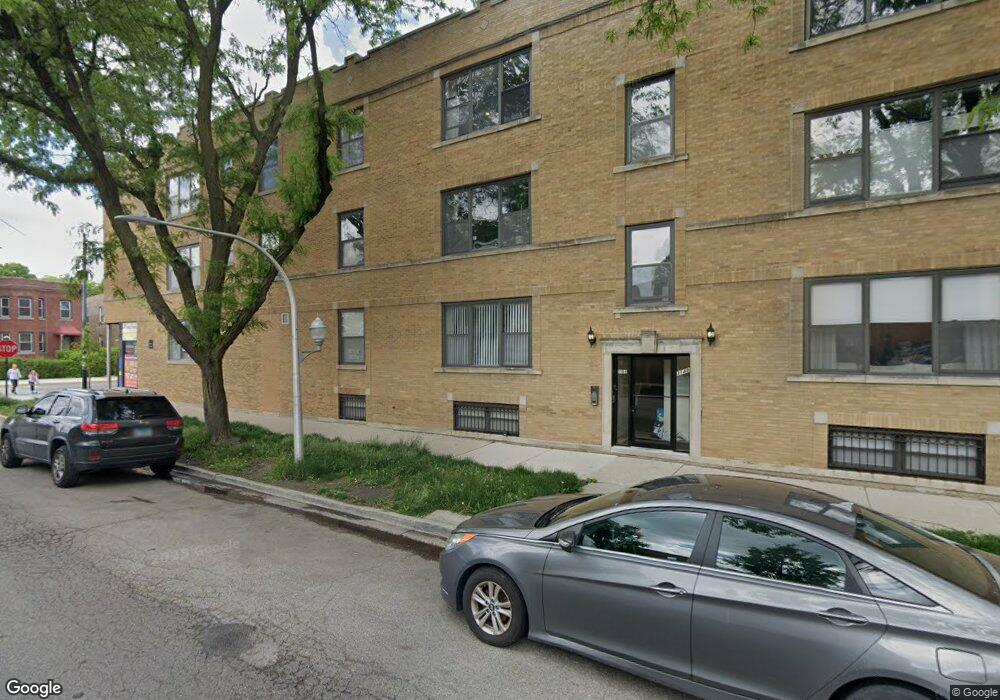
3148 W Byron St Unit 3 Chicago, IL 60618
Irving Park NeighborhoodEstimated Value: $239,270 - $299,000
2
Beds
1
Bath
943
Sq Ft
$289/Sq Ft
Est. Value
About This Home
This home is located at 3148 W Byron St Unit 3, Chicago, IL 60618 and is currently estimated at $272,318, approximately $288 per square foot. 3148 W Byron St Unit 3 is a home located in Cook County with nearby schools including Cleveland Elementary School, Schurz High School, and CICS Irving Park.
Ownership History
Date
Name
Owned For
Owner Type
Purchase Details
Closed on
May 4, 2022
Sold by
O'Krepky Joseph D and O'Krepky Samantha I
Bought by
Joseph D O'Krepky And Samantha O'Krepky Decla and O'Krepky
Current Estimated Value
Purchase Details
Closed on
May 3, 2022
Sold by
Okrepky Joseph D and Okrepky Samantha I
Bought by
Joseph D Okrepky And Samantha I Okrepky Decla and Okrepky
Purchase Details
Closed on
Sep 22, 2006
Sold by
Kecman Cosovic Developers Inc
Bought by
Okrepky Joseph
Home Financials for this Owner
Home Financials are based on the most recent Mortgage that was taken out on this home.
Original Mortgage
$185,600
Interest Rate
5.87%
Mortgage Type
New Conventional
Create a Home Valuation Report for This Property
The Home Valuation Report is an in-depth analysis detailing your home's value as well as a comparison with similar homes in the area
Home Values in the Area
Average Home Value in this Area
Purchase History
| Date | Buyer | Sale Price | Title Company |
|---|---|---|---|
| Joseph D O'Krepky And Samantha O'Krepky Decla | -- | -- | |
| Joseph D Okrepky And Samantha I Okrepky Decla | -- | None Listed On Document | |
| Joseph D Okrepky And Samantha I Okrepky Decla | -- | None Listed On Document | |
| Okrepky Joseph | $232,000 | Chicago Title Insurance Co |
Source: Public Records
Mortgage History
| Date | Status | Borrower | Loan Amount |
|---|---|---|---|
| Previous Owner | Okrepky Joseph | $185,600 |
Source: Public Records
Tax History Compared to Growth
Tax History
| Year | Tax Paid | Tax Assessment Tax Assessment Total Assessment is a certain percentage of the fair market value that is determined by local assessors to be the total taxable value of land and additions on the property. | Land | Improvement |
|---|---|---|---|---|
| 2024 | $3,388 | $18,828 | $2,335 | $16,493 |
| 2023 | $2,596 | $16,000 | $2,196 | $13,804 |
| 2022 | $2,596 | $16,000 | $2,196 | $13,804 |
| 2021 | $2,556 | $15,999 | $2,196 | $13,803 |
| 2020 | $1,951 | $11,831 | $828 | $11,003 |
| 2019 | $1,965 | $13,175 | $828 | $12,347 |
| 2018 | $1,930 | $13,175 | $828 | $12,347 |
| 2017 | $2,411 | $14,538 | $753 | $13,785 |
| 2016 | $2,420 | $14,538 | $753 | $13,785 |
| 2015 | $2,191 | $14,538 | $753 | $13,785 |
| 2014 | $3,040 | $18,891 | $677 | $18,214 |
| 2013 | $2,968 | $18,891 | $677 | $18,214 |
Source: Public Records
Map
Nearby Homes
- 3911 N Kedzie Ave
- 3815 N Kedzie Ave Unit 3S
- 3934 N Sawyer Ave
- 3801 N Kedzie Ave Unit 1S
- 3853 N Spaulding Ave
- 3748 N Troy St
- 4027 N Troy St
- 3042 W Irving Park Rd
- 4015 N Albany Ave
- 3024 W Irving Park Rd Unit 1S
- 3223 W Belle Plaine Ave
- 3940 N Christiana Ave
- 3350 W Grace St Unit 3
- 3718 N Spaulding Ave
- 3748 N Sacramento Ave
- 4116 N Kedzie Ave
- 3836 N Richmond St Unit 1N
- 3923 N Bernard St
- 4026 N Kimball Ave
- 4141 N Kedzie Ave Unit 307
- 3148 W Byron St Unit 31483
- 3903 N Kedzie Ave Unit 39033
- 3150 W Byron St Unit 31502
- 3148 W Byron St Unit 31482
- 3903 N Kedzie Ave Unit 39032
- 3150 W Byron St Unit 31501
- 3148 W Byron St Unit 31481
- 3150 W Byron St Unit 31503
- 3150 W Byron St Unit 3
- 3903 N Kedzie Ave Unit 2
- 3150 W Byron St Unit 2W
- 3150 W Byron St Unit 2
- 3150 W Byron St Unit 1
- 3148 W Byron St Unit 1
- 3903 N Kedzie Ave Unit 3
- 3148 W Byron St Unit 2
- 3903 N Kedzie Ave
- 3907 N Kedzie Ave Unit 2
- 3859 N Kedzie Ave
- 3913 N Kedzie Ave