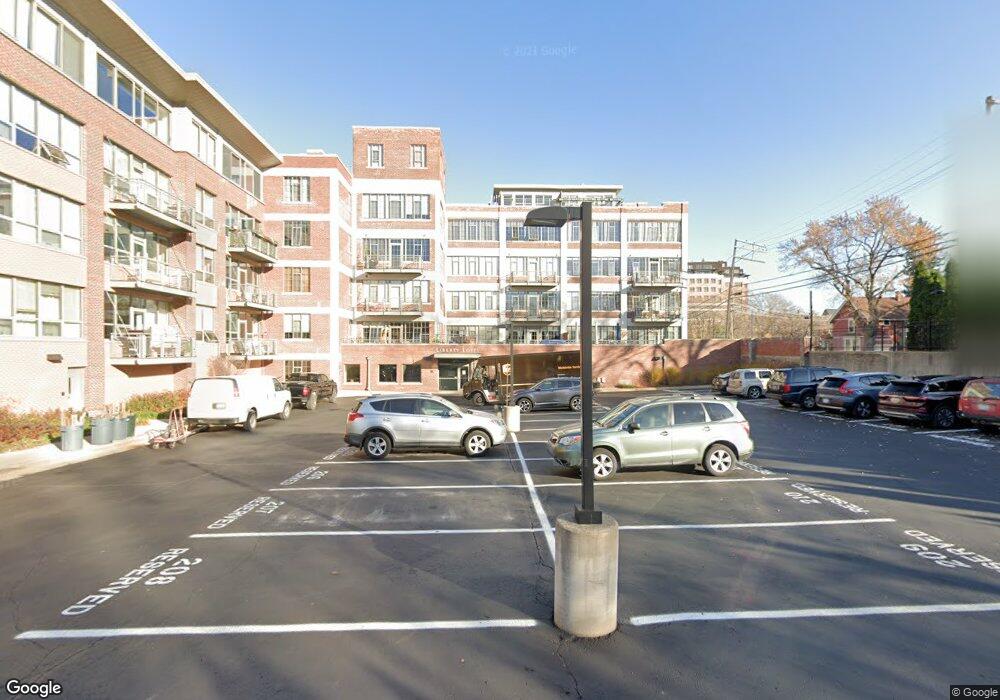
315 2nd St Unit 402 Ann Arbor, MI 48103
Old West Side NeighborhoodEstimated Value: $509,000 - $730,000
1
Bed
2
Baths
889
Sq Ft
$665/Sq Ft
Est. Value
About This Home
This home is located at 315 2nd St Unit 402, Ann Arbor, MI 48103 and is currently estimated at $591,058, approximately $664 per square foot. 315 2nd St Unit 402 is a home located in Washtenaw County with nearby schools including Bach Elementary School, Slauson Middle School, and Pioneer High School.
Ownership History
Date
Name
Owned For
Owner Type
Purchase Details
Closed on
Nov 3, 2021
Sold by
Patton William F and Trust Fbo Graham Thomas Patton
Bought by
Mclntyre Jeffrey Bayne and Mclntyre Linda Anne
Current Estimated Value
Home Financials for this Owner
Home Financials are based on the most recent Mortgage that was taken out on this home.
Original Mortgage
$379,200
Outstanding Balance
$293,592
Interest Rate
2.15%
Mortgage Type
New Conventional
Estimated Equity
$297,466
Purchase Details
Closed on
Jan 27, 2017
Sold by
Gillies Brian V and Buttitta Laura
Bought by
Graham Thomas Patton Trust
Purchase Details
Closed on
Oct 6, 2006
Sold by
Morningside Ann Arbor Llc
Bought by
Gillies Brian V
Home Financials for this Owner
Home Financials are based on the most recent Mortgage that was taken out on this home.
Original Mortgage
$250,000
Interest Rate
6.5%
Mortgage Type
New Conventional
Create a Home Valuation Report for This Property
The Home Valuation Report is an in-depth analysis detailing your home's value as well as a comparison with similar homes in the area
Home Values in the Area
Average Home Value in this Area
Purchase History
| Date | Buyer | Sale Price | Title Company |
|---|---|---|---|
| Mclntyre Jeffrey Bayne | $474,000 | Liberty Title | |
| Graham Thomas Patton Trust | $455,000 | Liberty Title | |
| Gillies Brian V | $350,800 | Philip R Seaver Title Co Inc |
Source: Public Records
Mortgage History
| Date | Status | Borrower | Loan Amount |
|---|---|---|---|
| Open | Mclntyre Jeffrey Bayne | $379,200 | |
| Previous Owner | Gillies Brian V | $250,000 |
Source: Public Records
Tax History Compared to Growth
Tax History
| Year | Tax Paid | Tax Assessment Tax Assessment Total Assessment is a certain percentage of the fair market value that is determined by local assessors to be the total taxable value of land and additions on the property. | Land | Improvement |
|---|---|---|---|---|
| 2025 | $13,684 | $287,700 | $0 | $0 |
| 2024 | $13,309 | $273,900 | $0 | $0 |
| 2023 | $15,841 | $242,300 | $0 | $0 |
| 2022 | $14,874 | $224,100 | $0 | $0 |
| 2021 | $11,174 | $217,800 | $0 | $0 |
| 2020 | $11,376 | $223,200 | $0 | $0 |
| 2019 | $11,200 | $226,600 | $226,600 | $0 |
| 2018 | $11,383 | $228,100 | $0 | $0 |
| 2017 | $8,004 | $218,900 | $0 | $0 |
| 2016 | $6,818 | $160,056 | $0 | $0 |
| 2015 | $7,354 | $159,578 | $0 | $0 |
| 2014 | $7,354 | $154,592 | $0 | $0 |
| 2013 | -- | $154,592 | $0 | $0 |
Source: Public Records
Map
Nearby Homes
- 404 W Liberty St
- 140 Ashley Mews Dr Unit 27
- 441 S Ashley St Unit 405
- 111 N Ashley St Unit 513
- 285 Mulholland St Unit 3
- 717 W Liberty St
- 533 5th St
- 212 Miller Ave Unit 102
- 212 Miller Ave Unit 203
- 212 Miller Ave Unit 302
- 212 Miller Ave Unit 101
- 212 Miller Ave Unit 201
- 212 Miller Ave Unit 301
- 212 Miller Ave Unit 103
- 814 W Jefferson St
- 552 5th St
- 220 W Mosley St
- 223 E Ann St Unit 6
- 220 S 7th St
- 410 N 1st St Unit 301
- 315 2nd St Unit 305
- 315 2nd St Unit 416
- 315 2nd St Unit 505
- 315 2nd St Unit 57
- 315 2nd St
- 315 2nd St Unit 214
- 315 2nd St Unit 212
- 315 2nd St Unit 409
- 315 2nd St Unit 508
- 315 2nd St
- 315 2nd St Unit 410
- 315 2nd St Unit 214
- 315 2nd St Unit 213
- 315 2nd St Unit 216
- 315 2nd St Unit 212
- 315 2nd St Unit 205
- 315 2nd St Unit 506
- 315 2nd St Unit 417
- 315 2nd St Unit 308
- 315 2nd St Unit 409