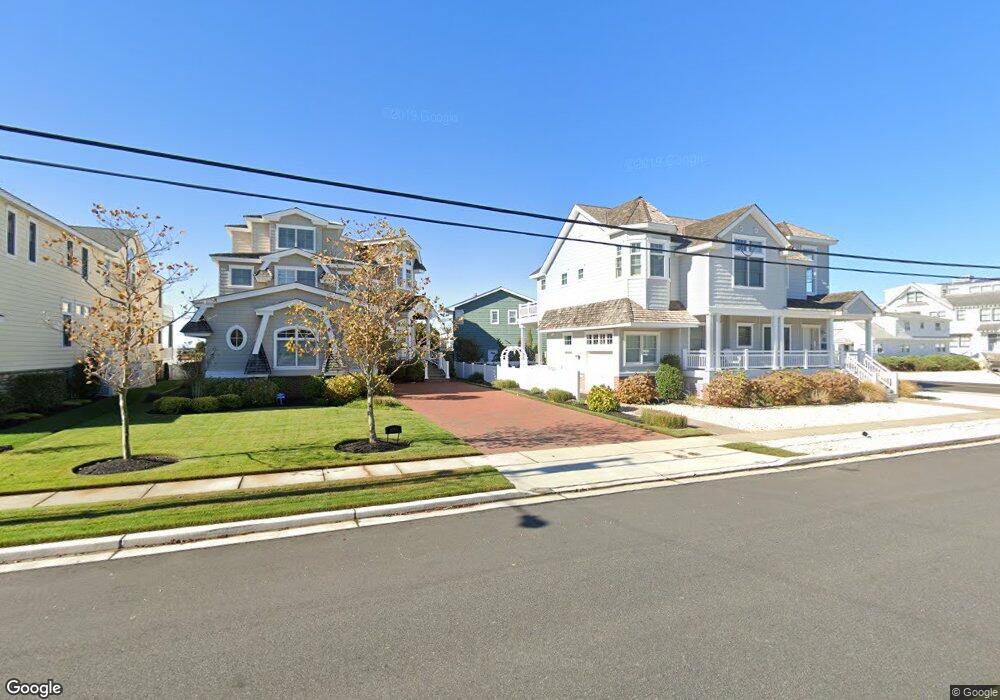
315 49th St Avalon, NJ 08202
Estimated Value: $5,495,234
Studio
--
Bath
2,569
Sq Ft
$2,139/Sq Ft
Est. Value
About This Home
This home is located at 315 49th St, Avalon, NJ 08202 and is currently estimated at $5,495,234, approximately $2,139 per square foot. 315 49th St is a home with nearby schools including Avalon Elementary School.
Ownership History
Date
Name
Owned For
Owner Type
Purchase Details
Closed on
Apr 14, 2000
Sold by
Scholler Agnes T
Bought by
Wright Amy
Current Estimated Value
Home Financials for this Owner
Home Financials are based on the most recent Mortgage that was taken out on this home.
Original Mortgage
$750,000
Interest Rate
8.5%
Purchase Details
Closed on
Apr 13, 1993
Sold by
Scholler William L and Scholler Agnes T
Bought by
Scholler William L and Scholler Agnes T
Create a Home Valuation Report for This Property
The Home Valuation Report is an in-depth analysis detailing your home's value as well as a comparison with similar homes in the area
Home Values in the Area
Average Home Value in this Area
Purchase History
| Date | Buyer | Sale Price | Title Company |
|---|---|---|---|
| Wright Amy | $1,150,000 | -- | |
| Scholler William L | -- | -- |
Source: Public Records
Mortgage History
| Date | Status | Borrower | Loan Amount |
|---|---|---|---|
| Previous Owner | Wright Amy | $750,000 |
Source: Public Records
Tax History
| Year | Tax Paid | Tax Assessment Tax Assessment Total Assessment is a certain percentage of the fair market value that is determined by local assessors to be the total taxable value of land and additions on the property. | Land | Improvement |
|---|---|---|---|---|
| 2025 | $16,338 | $2,362,500 | $2,362,500 | -- |
| 2024 | $16,338 | $2,660,900 | $2,362,500 | $298,400 |
| 2023 | $16,205 | $2,660,900 | $2,362,500 | $298,400 |
| 2022 | $15,114 | $2,660,900 | $2,362,500 | $298,400 |
| 2021 | $13,571 | $2,660,900 | $2,362,500 | $298,400 |
| 2020 | $13,996 | $2,660,900 | $2,362,500 | $298,400 |
| 2019 | $13,571 | $2,660,900 | $2,362,500 | $298,400 |
| 2018 | $12,985 | $2,660,900 | $2,362,500 | $298,400 |
| 2017 | $14,702 | $2,644,200 | $2,335,400 | $308,800 |
| 2016 | $14,543 | $2,644,200 | $2,335,400 | $308,800 |
| 2015 | $14,305 | $2,644,200 | $2,335,400 | $308,800 |
| 2014 | $14,146 | $2,644,200 | $2,335,400 | $308,800 |
Source: Public Records
Map
Nearby Homes
- 4640 Ocean Dr
- 4610 4th Ave
- 5499 Dune Dr
- 256 42nd St
- 264 41st St
- 5765 Ocean Dr
- 4040 Dune Dr
- 198 40th St
- 6229 Dune Dr
- 253 35th St Unit WEST
- 3429 Dune Dr
- 150 64th St
- 162 33rd St
- 173 33rd St Unit 3
- 179 32nd St
- 6762 Ocean Dr Unit 6762
- 6772 Ocean Dr Unit 6772
- 55 32nd St W Unit C2B
- 55 32nd St W
- 55 32nd St W Unit 1A
Your Personal Tour Guide
Ask me questions while you tour the home.