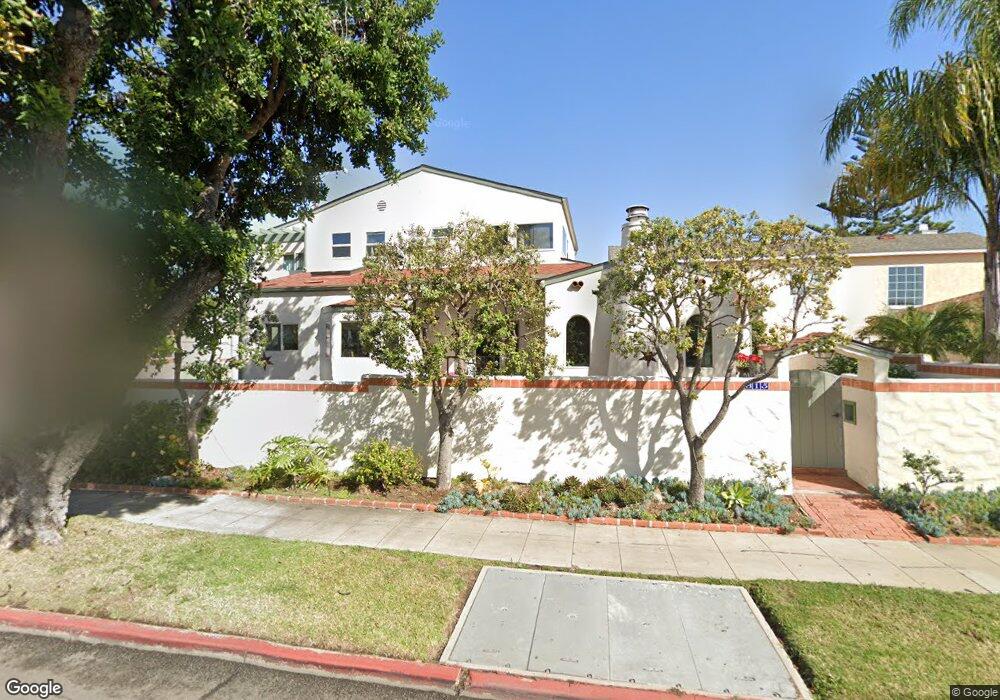
315 4th St Coronado, CA 92118
Estimated Value: $2,856,000 - $3,325,000
3
Beds
3
Baths
2,053
Sq Ft
$1,491/Sq Ft
Est. Value
About This Home
This home is located at 315 4th St, Coronado, CA 92118 and is currently estimated at $3,061,646, approximately $1,491 per square foot. 315 4th St is a home located in San Diego County with nearby schools including Coronado Village Elementary, Coronado Middle School, and Coronado High School.
Ownership History
Date
Name
Owned For
Owner Type
Purchase Details
Closed on
Apr 19, 2024
Sold by
Serna Virginia
Bought by
Serna Family Trust and Serna
Current Estimated Value
Purchase Details
Closed on
Mar 8, 2012
Sold by
Otero Eduardo M
Bought by
Otero Eduardo M and Serna Virginia O
Purchase Details
Closed on
Nov 30, 2006
Sold by
Serna Stephen P and Serna Virginia O
Bought by
Otero Eduardo M and Otero Elizabeth R
Purchase Details
Closed on
Nov 5, 1997
Sold by
Serna Family Trust 12-21-92 and Stephen P
Bought by
Serna Stephen P and Serna Virginia O
Home Financials for this Owner
Home Financials are based on the most recent Mortgage that was taken out on this home.
Original Mortgage
$164,000
Interest Rate
6.86%
Purchase Details
Closed on
Aug 19, 1981
Sold by
Otero Inter Vivos Trust
Bought by
Serna Virginia
Create a Home Valuation Report for This Property
The Home Valuation Report is an in-depth analysis detailing your home's value as well as a comparison with similar homes in the area
Home Values in the Area
Average Home Value in this Area
Purchase History
| Date | Buyer | Sale Price | Title Company |
|---|---|---|---|
| Serna Family Trust | -- | None Listed On Document | |
| Otero Eduardo M | -- | None Available | |
| Otero Eduardo M | $1,100,000 | None Available | |
| Serna Stephen P | -- | Southland Title | |
| Serna Virginia | -- | None Listed On Document |
Source: Public Records
Mortgage History
| Date | Status | Borrower | Loan Amount |
|---|---|---|---|
| Previous Owner | Serna Stephen P | $164,000 |
Source: Public Records
Tax History
| Year | Tax Paid | Tax Assessment Tax Assessment Total Assessment is a certain percentage of the fair market value that is determined by local assessors to be the total taxable value of land and additions on the property. | Land | Improvement |
|---|---|---|---|---|
| 2025 | $29,530 | $2,809,080 | $2,496,960 | $312,120 |
| 2024 | $29,530 | $2,754,000 | $2,448,000 | $306,000 |
| 2023 | $29,055 | $2,700,000 | $2,400,000 | $300,000 |
| 2022 | $3,585 | $279,603 | $96,155 | $183,448 |
| 2021 | $3,539 | $274,121 | $94,270 | $179,851 |
| 2020 | $3,455 | $271,311 | $93,304 | $178,007 |
| 2019 | $3,446 | $265,992 | $91,475 | $174,517 |
| 2018 | $3,396 | $260,778 | $89,682 | $171,096 |
| 2017 | $3,044 | $230,666 | $87,924 | $142,742 |
| 2016 | $2,929 | $226,144 | $86,200 | $139,944 |
| 2015 | $2,855 | $222,748 | $84,906 | $137,842 |
| 2014 | $2,757 | $218,385 | $83,243 | $135,142 |
Source: Public Records
Map
Nearby Homes
Your Personal Tour Guide
Ask me questions while you tour the home.