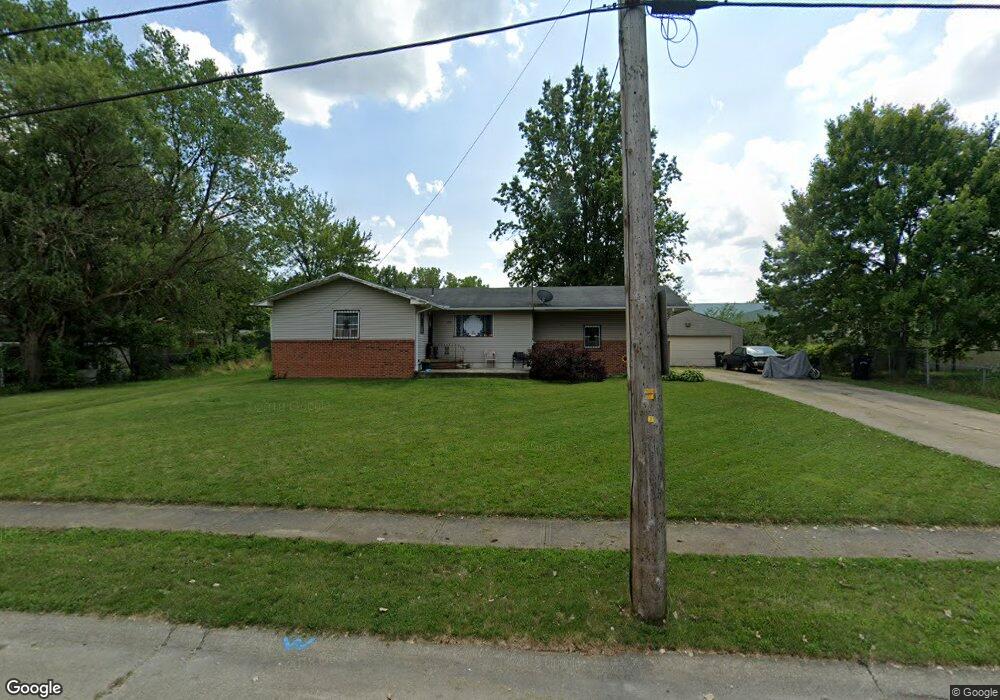
315 Brace Ave Elyria, OH 44035
Estimated Value: $141,000 - $180,000
3
Beds
1
Bath
1,544
Sq Ft
$103/Sq Ft
Est. Value
About This Home
This home is located at 315 Brace Ave, Elyria, OH 44035 and is currently estimated at $158,791, approximately $102 per square foot. 315 Brace Ave is a home located in Lorain County with nearby schools including Crestwood Elementary School, Westwood Middle School, and Elyria High School.
Ownership History
Date
Name
Owned For
Owner Type
Purchase Details
Closed on
Mar 7, 2006
Sold by
Stringer Levy and Stringer Lisa
Bought by
Stringer Ii Levy
Current Estimated Value
Home Financials for this Owner
Home Financials are based on the most recent Mortgage that was taken out on this home.
Original Mortgage
$63,835
Outstanding Balance
$44,469
Interest Rate
10.5%
Mortgage Type
New Conventional
Estimated Equity
$114,322
Purchase Details
Closed on
Feb 28, 2006
Sold by
Smith Wiley B and Stringer Lisa
Bought by
Stringer Levy and Stringer Lisa
Home Financials for this Owner
Home Financials are based on the most recent Mortgage that was taken out on this home.
Original Mortgage
$63,835
Outstanding Balance
$44,469
Interest Rate
10.5%
Mortgage Type
New Conventional
Estimated Equity
$114,322
Purchase Details
Closed on
Jul 29, 2002
Sold by
Smith Katherine
Bought by
Smith Wiley
Home Financials for this Owner
Home Financials are based on the most recent Mortgage that was taken out on this home.
Original Mortgage
$56,500
Interest Rate
6.7%
Create a Home Valuation Report for This Property
The Home Valuation Report is an in-depth analysis detailing your home's value as well as a comparison with similar homes in the area
Home Values in the Area
Average Home Value in this Area
Purchase History
| Date | Buyer | Sale Price | Title Company |
|---|---|---|---|
| Stringer Ii Levy | -- | None Available | |
| Stringer Levy | $75,100 | None Available | |
| Smith Wiley | $95,000 | Midland Title |
Source: Public Records
Mortgage History
| Date | Status | Borrower | Loan Amount |
|---|---|---|---|
| Open | Stringer Ii Levy | $63,835 | |
| Previous Owner | Smith Wiley | $56,500 |
Source: Public Records
Tax History
| Year | Tax Paid | Tax Assessment Tax Assessment Total Assessment is a certain percentage of the fair market value that is determined by local assessors to be the total taxable value of land and additions on the property. | Land | Improvement |
|---|---|---|---|---|
| 2024 | $1,694 | $44,905 | $6,825 | $38,080 |
| 2023 | $1,293 | $32,151 | $4,197 | $27,955 |
| 2022 | $1,295 | $32,151 | $4,197 | $27,955 |
| 2021 | $1,782 | $32,151 | $4,197 | $27,955 |
| 2020 | $1,657 | $26,550 | $3,470 | $23,080 |
| 2019 | $1,647 | $26,550 | $3,470 | $23,080 |
| 2018 | $1,732 | $26,550 | $3,470 | $23,080 |
| 2017 | $1,814 | $28,030 | $3,620 | $24,410 |
| 2016 | $1,758 | $28,030 | $3,620 | $24,410 |
| 2015 | $1,647 | $28,030 | $3,620 | $24,410 |
| 2014 | $1,627 | $28,030 | $3,620 | $24,410 |
| 2013 | $1,611 | $28,030 | $3,620 | $24,410 |
Source: Public Records
Map
Nearby Homes
Your Personal Tour Guide
Ask me questions while you tour the home.