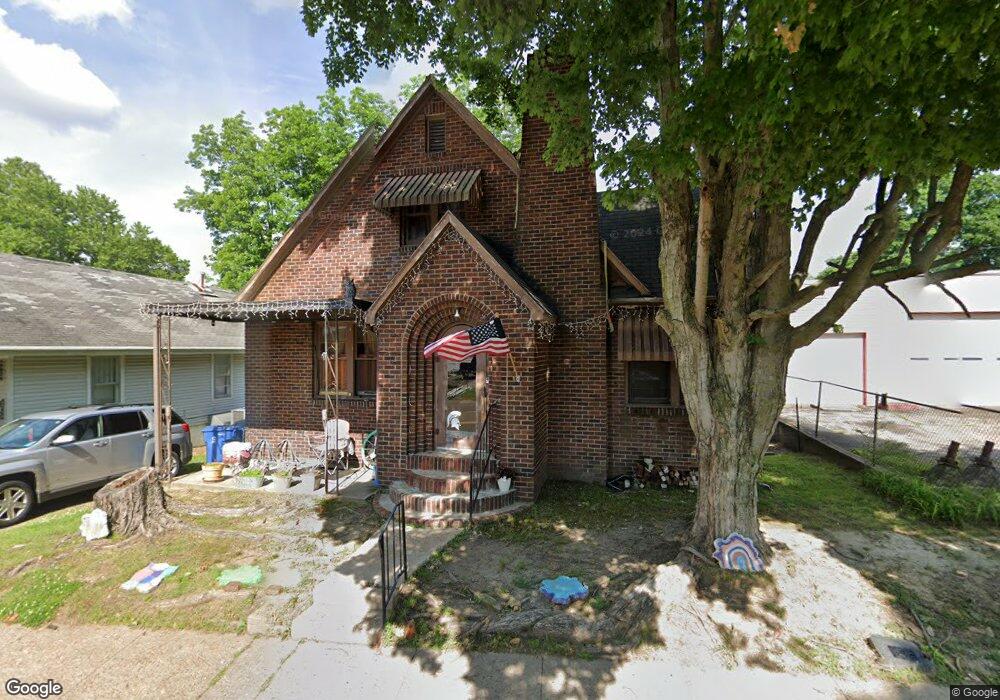
315 Broadway St South Fulton, TN 38257
Estimated Value: $88,000 - $166,000
--
Bed
2
Baths
1,203
Sq Ft
$100/Sq Ft
Est. Value
About This Home
This home is located at 315 Broadway St, South Fulton, TN 38257 and is currently estimated at $120,631, approximately $100 per square foot. 315 Broadway St is a home located in Obion County.
Ownership History
Date
Name
Owned For
Owner Type
Purchase Details
Closed on
Jul 14, 2002
Bought by
Bell Kathy
Current Estimated Value
Purchase Details
Closed on
Jan 10, 1997
Sold by
Connell Thomas C
Bought by
Dennis Pritchard
Purchase Details
Closed on
Oct 30, 1992
Bought by
Connell Thomas C and Connell Violet M
Purchase Details
Closed on
Jun 14, 1991
Bought by
Hood David C
Purchase Details
Closed on
Apr 5, 1944
Bought by
Sandford R E
Purchase Details
Closed on
Jan 1, 1944
Create a Home Valuation Report for This Property
The Home Valuation Report is an in-depth analysis detailing your home's value as well as a comparison with similar homes in the area
Home Values in the Area
Average Home Value in this Area
Purchase History
| Date | Buyer | Sale Price | Title Company |
|---|---|---|---|
| Bell Kathy | $37,000 | -- | |
| Dennis Pritchard | $45,000 | -- | |
| Connell Thomas C | $29,000 | -- | |
| Hood David C | $30,000 | -- | |
| Sandford R E | -- | -- | |
| -- | -- | -- |
Source: Public Records
Tax History Compared to Growth
Tax History
| Year | Tax Paid | Tax Assessment Tax Assessment Total Assessment is a certain percentage of the fair market value that is determined by local assessors to be the total taxable value of land and additions on the property. | Land | Improvement |
|---|---|---|---|---|
| 2025 | -- | $26,925 | $0 | $0 |
| 2024 | -- | $26,925 | $1,200 | $25,725 |
| 2023 | $678 | $26,925 | $1,200 | $25,725 |
| 2022 | $242 | $12,725 | $1,000 | $11,725 |
| 2021 | $237 | $12,725 | $1,000 | $11,725 |
| 2020 | $242 | $12,725 | $1,000 | $11,725 |
| 2019 | $455 | $12,725 | $1,000 | $11,725 |
| 2018 | $455 | $12,725 | $1,000 | $11,725 |
| 2017 | $437 | $11,650 | $1,000 | $10,650 |
| 2016 | $437 | $11,650 | $1,000 | $10,650 |
| 2015 | $437 | $11,650 | $1,000 | $10,650 |
| 2014 | $437 | $11,650 | $1,000 | $10,650 |
Source: Public Records
Map
Nearby Homes
- 407 Oliver Dr
- 104 Park Ave Unit F
- 0 State Route 129
- 508 Vancil St
- 204 Park St
- 507 Vancil St
- 304 Eddings St
- 310 2nd St Unit F
- 509 Vancil St
- 803 Walnut St
- 411 Honey Locust Dr
- 413 Honey Locust Dr
- 709 Tennessee St
- 109 West St
- 811 Key St
- 219 4th St Unit F
- 608 Green St
- 311 4th St Unit 311 Fourth Street
- 505 Park Ave Unit F
- 1015 W 4th St
- 313 Broadway St
- 310 Central Ave
- 314 Central Ave
- 309 Broadway St
- 309 Broadway St
- 308 Central Ave
- 314 Broadway St
- 312 Broadway St
- 400 Central Ave
- 401 Broadway St
- 313 Central Ave
- 305 Broadway St
- 315 Central Ave
- 309 Central Ave
- 200 W Smith St
- 402 Central Ave
- 306 Broadway St
- 400 Glendale St
- 304 Central Ave
- 301 Broadway St