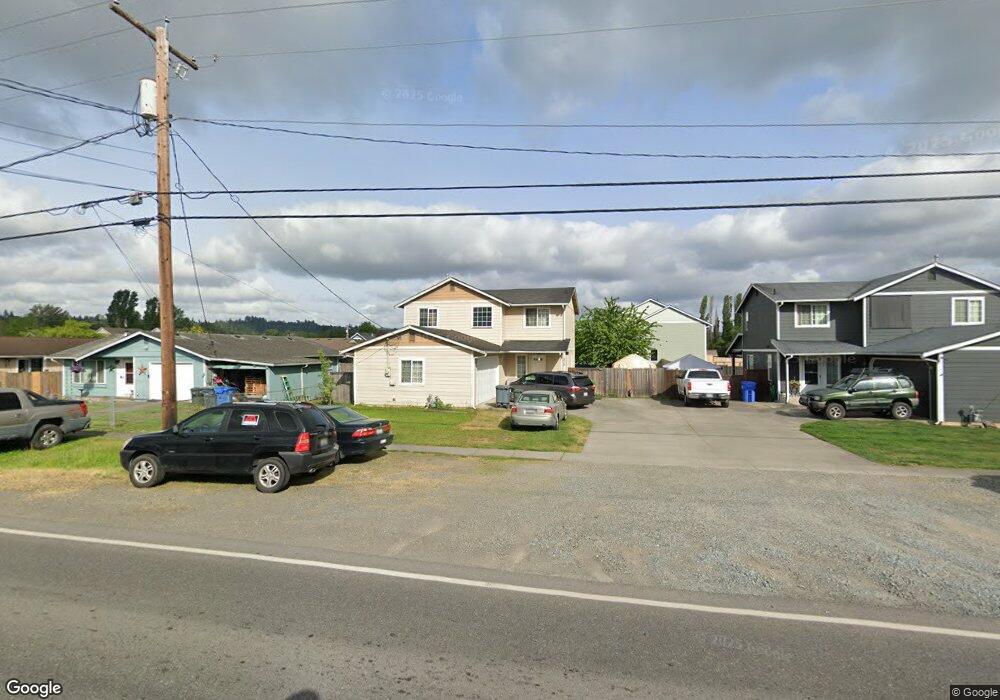
315 Calistoga St W Orting, WA 98360
Estimated Value: $487,000 - $518,000
4
Beds
3
Baths
1,684
Sq Ft
$296/Sq Ft
Est. Value
About This Home
This home is located at 315 Calistoga St W, Orting, WA 98360 and is currently estimated at $499,149, approximately $296 per square foot. 315 Calistoga St W is a home located in Pierce County with nearby schools including Orting Elementary School, Ptarmigan Ridge Elementary School, and Orting Middle School.
Ownership History
Date
Name
Owned For
Owner Type
Purchase Details
Closed on
Feb 28, 2012
Sold by
Fannie Mae
Bought by
Chan Sopheap
Current Estimated Value
Home Financials for this Owner
Home Financials are based on the most recent Mortgage that was taken out on this home.
Original Mortgage
$146,099
Outstanding Balance
$100,168
Interest Rate
3.83%
Mortgage Type
FHA
Estimated Equity
$398,981
Purchase Details
Closed on
Aug 16, 2011
Sold by
Bates Jaime and Maggior Robert
Bought by
Federal National Mortgage Association
Purchase Details
Closed on
Feb 12, 2008
Sold by
Frontier Contractors Inc
Bought by
Bates Jaime and Maggiore Robert
Home Financials for this Owner
Home Financials are based on the most recent Mortgage that was taken out on this home.
Original Mortgage
$239,950
Interest Rate
6.04%
Mortgage Type
Unknown
Purchase Details
Closed on
Jul 5, 2006
Sold by
Goff David and Goff Lisa
Bought by
Frontier Contractors Inc
Home Financials for this Owner
Home Financials are based on the most recent Mortgage that was taken out on this home.
Original Mortgage
$357,000
Interest Rate
6.63%
Mortgage Type
Construction
Create a Home Valuation Report for This Property
The Home Valuation Report is an in-depth analysis detailing your home's value as well as a comparison with similar homes in the area
Home Values in the Area
Average Home Value in this Area
Purchase History
| Date | Buyer | Sale Price | Title Company |
|---|---|---|---|
| Chan Sopheap | -- | Stewart Title Company | |
| Federal National Mortgage Association | $208,724 | First American | |
| Bates Jaime | $239,950 | Fidelity National Title Insu | |
| Frontier Contractors Inc | $140,000 | Fidelity National Title Insu |
Source: Public Records
Mortgage History
| Date | Status | Borrower | Loan Amount |
|---|---|---|---|
| Open | Chan Sopheap | $146,099 | |
| Previous Owner | Bates Jaime | $239,950 | |
| Previous Owner | Frontier Contractors Inc | $357,000 |
Source: Public Records
Tax History Compared to Growth
Tax History
| Year | Tax Paid | Tax Assessment Tax Assessment Total Assessment is a certain percentage of the fair market value that is determined by local assessors to be the total taxable value of land and additions on the property. | Land | Improvement |
|---|---|---|---|---|
| 2025 | $3,811 | $467,600 | $170,800 | $296,800 |
| 2024 | $3,811 | $444,100 | $161,800 | $282,300 |
| 2023 | $3,811 | $410,700 | $154,600 | $256,100 |
| 2022 | $3,741 | $427,100 | $154,600 | $272,500 |
| 2021 | $3,591 | $296,600 | $101,300 | $195,300 |
| 2019 | $3,270 | $269,600 | $86,000 | $183,600 |
| 2018 | $3,373 | $253,700 | $74,900 | $178,800 |
| 2017 | $2,982 | $223,700 | $60,200 | $163,500 |
| 2016 | $2,741 | $176,900 | $46,500 | $130,400 |
| 2014 | $2,275 | $163,600 | $41,600 | $122,000 |
| 2013 | $2,275 | $136,800 | $32,700 | $104,100 |
Source: Public Records
Map
Nearby Homes
- 215 Corrin Ave NW Unit B
- 215 Corrin Ave NW Unit A
- 506 Deeded Ln SW
- 322 Orting Ave NW
- 213 Bridge St SW
- 211 Bridge St SW
- 503 Coe Ln SW
- 718 Teetor Cir NW Unit LOT 9
- 724 Teetor Cir NW Unit LOT 12
- 726 Teetor Cir NW Unit Lot 13
- 304 Varner Ave SE
- 731 Teetor Cir NW Unit LOT 14
- 710 Teetor Cir NW
- 710 Teetor Cir NW Unit LOT 5
- 730 Teetor Cir NW Unit LOT 31
- 708 Teetor Cir NW Unit LOT 4
- 706 Teetor Cir NW Unit LOT 3
- 728 Teetor Cir NW Unit Lot 30
- 721 Teetor Cir NW Unit Lot 19
- 721 Teetor Cir NW
- 317 Calistoga St W
- 313 Calistoga St W
- 106 Tacoma Ave NW
- 309 Calistoga St W
- 318 Calistoga St W
- 307 Calistoga St W
- 114 Tacoma Ave NW
- 401 Calistoga St W
- 305 Calistoga St W
- 305 Calistoga St W Unit 1 & 2
- 314 Calistoga St W
- 115 Eldredge Ave NW Unit A&B
- 115 Eldredge Ave NW
- 115 Eldredge Ave NW Unit B
- 120 Tacoma Ave NW
- 312 Calistoga St W
- 111 Tacoma Ave NW
- 112 Tacoma Ave S
- 106 Tacoma Ave S
- 303 Calistoga St W