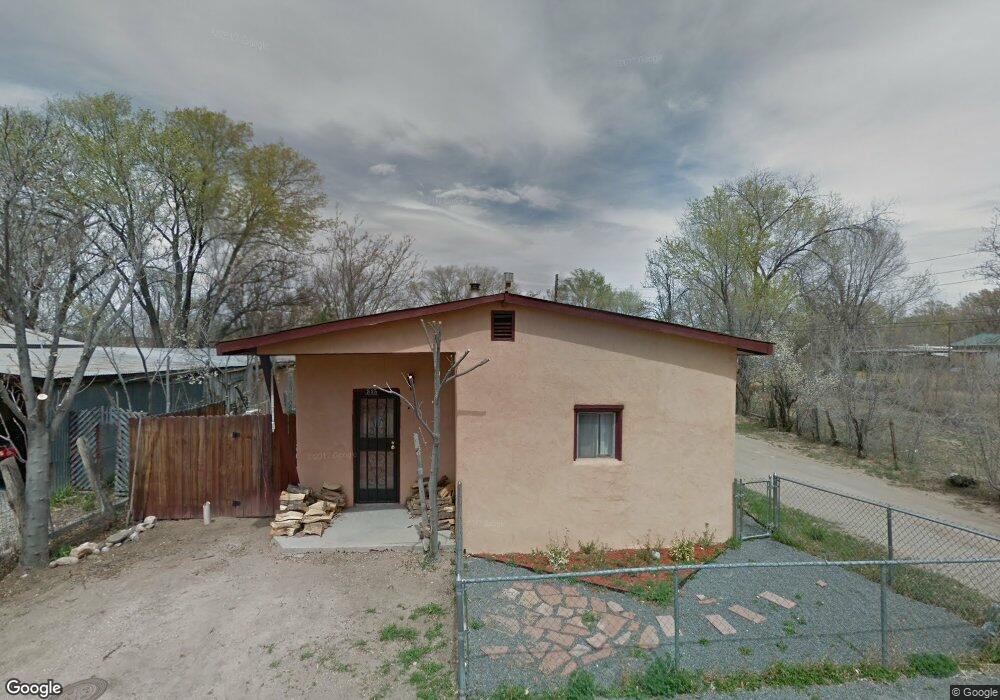
315 Camino Del Sol Espanola, NM 87532
Estimated Value: $171,563 - $322,000
2
Beds
1
Bath
740
Sq Ft
$313/Sq Ft
Est. Value
About This Home
This home is located at 315 Camino Del Sol, Espanola, NM 87532 and is currently estimated at $231,891, approximately $313 per square foot. 315 Camino Del Sol is a home located in Santa Fe County with nearby schools including Espanola Valley High School, Carinos De Los Ninos, and Holy Cross Catholic School.
Ownership History
Date
Name
Owned For
Owner Type
Purchase Details
Closed on
Aug 28, 2013
Sold by
Rodriguez Estevan A
Bought by
Trujillo Martin D
Current Estimated Value
Purchase Details
Closed on
Mar 12, 2012
Sold by
Vantium Reo Capital Markets Lp
Bought by
Rodriguez Rudy F and Rodriguez Julie
Purchase Details
Closed on
Aug 30, 2011
Sold by
Duran Ross E
Bought by
Reo Capital Markets L P
Purchase Details
Closed on
Oct 21, 2005
Sold by
Rivera Mary Ann Archuleta and Duran Carol
Bought by
Duran Ross E
Home Financials for this Owner
Home Financials are based on the most recent Mortgage that was taken out on this home.
Original Mortgage
$82,450
Interest Rate
5.75%
Mortgage Type
Fannie Mae Freddie Mac
Purchase Details
Closed on
Feb 2, 2000
Sold by
Archuleta Roberto and Archuleta Adelina M
Bought by
Rivera Mary Ann Archuleta and Duran Carol
Create a Home Valuation Report for This Property
The Home Valuation Report is an in-depth analysis detailing your home's value as well as a comparison with similar homes in the area
Home Values in the Area
Average Home Value in this Area
Purchase History
| Date | Buyer | Sale Price | Title Company |
|---|---|---|---|
| Trujillo Martin D | -- | None Available | |
| Rodriguez Rudy F | -- | St&E | |
| Reo Capital Markets L P | -- | None Available | |
| Duran Ross E | -- | Landamerica Capitol City Tit | |
| Rivera Mary Ann Archuleta | -- | -- |
Source: Public Records
Mortgage History
| Date | Status | Borrower | Loan Amount |
|---|---|---|---|
| Previous Owner | Duran Ross E | $82,450 |
Source: Public Records
Tax History Compared to Growth
Tax History
| Year | Tax Paid | Tax Assessment Tax Assessment Total Assessment is a certain percentage of the fair market value that is determined by local assessors to be the total taxable value of land and additions on the property. | Land | Improvement |
|---|---|---|---|---|
| 2024 | $470 | $79,121 | $29,582 | $49,539 |
| 2023 | $461 | $76,818 | $28,721 | $48,097 |
| 2022 | $441 | $74,582 | $27,885 | $46,697 |
| 2021 | $394 | $24,137 | $9,024 | $15,113 |
| 2020 | $397 | $23,434 | $9,024 | $14,410 |
| 2019 | $373 | $22,752 | $9,024 | $13,728 |
| 2018 | $337 | $22,752 | $9,024 | $13,728 |
| 2017 | $587 | $30,318 | $18,333 | $11,985 |
| 2016 | $718 | $34,405 | $20,720 | $13,685 |
| 2015 | $677 | $33,404 | $19,717 | $13,687 |
| 2014 | $627 | $32,399 | $18,999 | $13,400 |
Source: Public Records
Map
Nearby Homes
- 305 A&B Camino Del Sol
- 111 A&B Calle Don Diego Rd
- 0 Las Vegas St
- 629 Las Vegas St
- 621 Las Vegas St
- 1004 New Mexico 76
- 1004 Nm 76
- 1023 Nm 76
- 314 Calle Lucia
- 1113 A New Mexico 76
- 120 N Railroad Ave
- 514 Roman Dr E
- 932 E Pueblo Dr
- 608 E Hill St
- 526 Camino Arbolera
- 111 Calle Don Diego
- 909 N Railroad Ave
- 607 Union Hall Ln
- 720 School St
- 722 School St Unit B
- 309 Camino Del Sol
- Z-3 Camino Del Sol
- Y-2 Camino Del Sol
- Y-1 Camino Del Sol
- Y-3 Camino Del Sol
- 312 Camino Del Sol
- 307 Camino Del Sol
- 420 Questa Ln
- 409 Camino Del Sol
- 406 Camino Del Sol
- 310 Camino Del Sol
- 312 Questa Ln
- 308 Camino Del Sol Unit B
- 308 Camino Del Sol Unit A
- 308 Camino Del Sol
- 305 A&B Camino Del Sol Unit A
- 308a Camino Del Sol
- 315 E Solano Dr
- 305 Camino Del Sol
- 422 Questa Ln