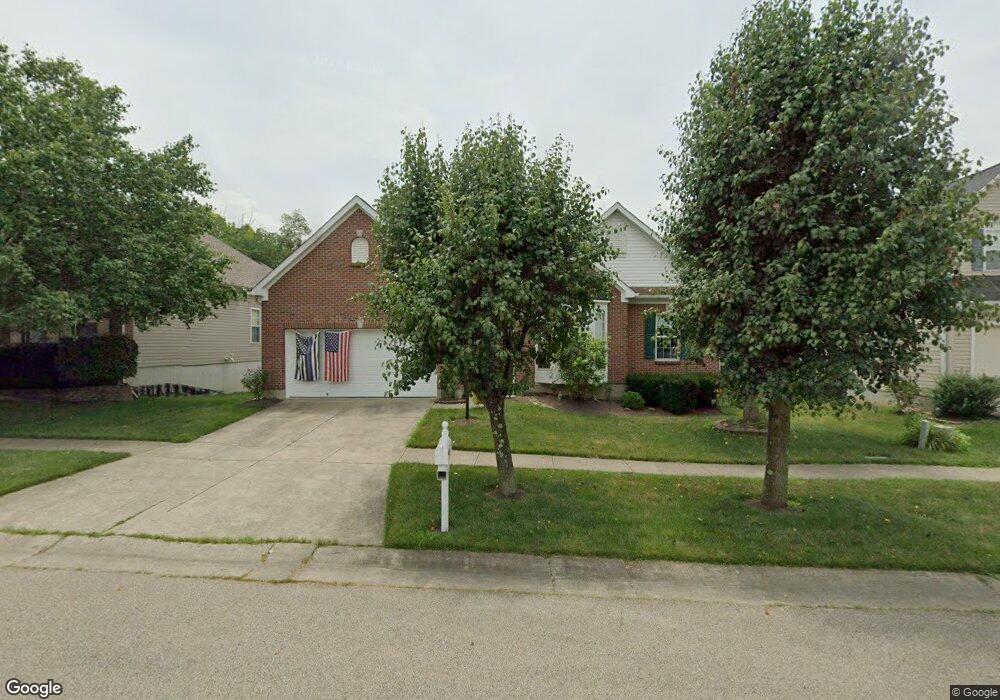
315 Delaware Dr Maineville, OH 45039
Estimated Value: $390,818 - $430,000
3
Beds
3
Baths
1,794
Sq Ft
$230/Sq Ft
Est. Value
About This Home
This home is located at 315 Delaware Dr, Maineville, OH 45039 and is currently estimated at $412,455, approximately $229 per square foot. 315 Delaware Dr is a home located in Warren County with nearby schools including Little Miami Early Childhood Center, Little Miami Intermediate Middle School, and Little Miami Middle School.
Ownership History
Date
Name
Owned For
Owner Type
Purchase Details
Closed on
Feb 13, 2015
Sold by
Korb Henry G and Korb Patricia E
Bought by
The Henry G Korb & Patricia E Korb Tust and Korb Patricia E
Current Estimated Value
Purchase Details
Closed on
Apr 29, 2005
Sold by
Nvr Inc
Bought by
Korb Henry G and Korb Patricia E
Home Financials for this Owner
Home Financials are based on the most recent Mortgage that was taken out on this home.
Original Mortgage
$171,580
Outstanding Balance
$83,861
Interest Rate
5.37%
Mortgage Type
Fannie Mae Freddie Mac
Estimated Equity
$328,594
Purchase Details
Closed on
Apr 6, 2005
Sold by
Gallenstein Brothers Inc
Bought by
Nvr Inc
Home Financials for this Owner
Home Financials are based on the most recent Mortgage that was taken out on this home.
Original Mortgage
$171,580
Outstanding Balance
$83,861
Interest Rate
5.37%
Mortgage Type
Fannie Mae Freddie Mac
Estimated Equity
$328,594
Create a Home Valuation Report for This Property
The Home Valuation Report is an in-depth analysis detailing your home's value as well as a comparison with similar homes in the area
Home Values in the Area
Average Home Value in this Area
Purchase History
| Date | Buyer | Sale Price | Title Company |
|---|---|---|---|
| The Henry G Korb & Patricia E Korb Tust | -- | None Available | |
| Korb Henry G | $241,600 | First Title Agency Inc | |
| Nvr Inc | $125,833 | First Title |
Source: Public Records
Mortgage History
| Date | Status | Borrower | Loan Amount |
|---|---|---|---|
| Open | Korb Henry G | $171,580 |
Source: Public Records
Tax History
| Year | Tax Paid | Tax Assessment Tax Assessment Total Assessment is a certain percentage of the fair market value that is determined by local assessors to be the total taxable value of land and additions on the property. | Land | Improvement |
|---|---|---|---|---|
| 2025 | $5,587 | $125,550 | $24,500 | $101,050 |
| 2024 | $5,587 | $125,550 | $24,500 | $101,050 |
| 2023 | $5,214 | $104,559 | $15,067 | $89,491 |
| 2022 | $5,152 | $104,559 | $15,068 | $89,492 |
| 2021 | $4,912 | $104,559 | $15,068 | $89,492 |
| 2020 | $4,678 | $85,008 | $12,250 | $72,758 |
| 2019 | $4,756 | $85,008 | $12,250 | $72,758 |
| 2018 | $4,631 | $85,008 | $12,250 | $72,758 |
| 2017 | $3,847 | $70,459 | $10,147 | $60,312 |
| 2016 | $3,939 | $70,459 | $10,147 | $60,312 |
| 2015 | $3,936 | $70,459 | $10,147 | $60,312 |
| 2014 | $4,162 | $65,850 | $9,480 | $56,370 |
| 2013 | $4,066 | $85,070 | $12,250 | $72,820 |
Source: Public Records
Map
Nearby Homes
- 398 Wyndham Dr
- 7336 Welbeck Dr
- 6824 Ohio 48
- 6748 Sandharbor Ct
- 6740 Sandharbor Ct
- 6762 Sandharbor Ct
- 1382 Brookchase Cir
- 880 Sunrise Ridge Ct
- 7540 Robin Dr
- 6636 Honeysuckle Ln
- 6804 Mossy Rock Ct
- 959 Weeping Willow Ln
- Lot French Ct
- 437 Crossbow Dr
- 1 Lot French Ct
- 250 Hartford Ct
- 988 Weeping Willow Ln
- 241 Hartford Ct
- 6512 Arbor Ct
- 219 Hartford Ct
- 309 Delaware Dr
- 321 Delaware Dr
- 327 Delaware Dr
- 303 Delaware Dr
- 316 Delaware Dr
- 322 Delaware Dr
- 310 Delaware Dr
- 328 Delaware Dr
- 333 Delaware Dr
- 304 Delaware Dr
- 336 Delaware Dr
- 298 Delaware Dr
- 339 Delaware Dr
- 273 Coyote Dr
- 267 Coyote Dr
- 279 Coyote Dr
- 261 Coyote Dr
- 358 Wyndham Dr
- 370 Wyndham Dr
- 253 Coyote Dr
Your Personal Tour Guide
Ask me questions while you tour the home.