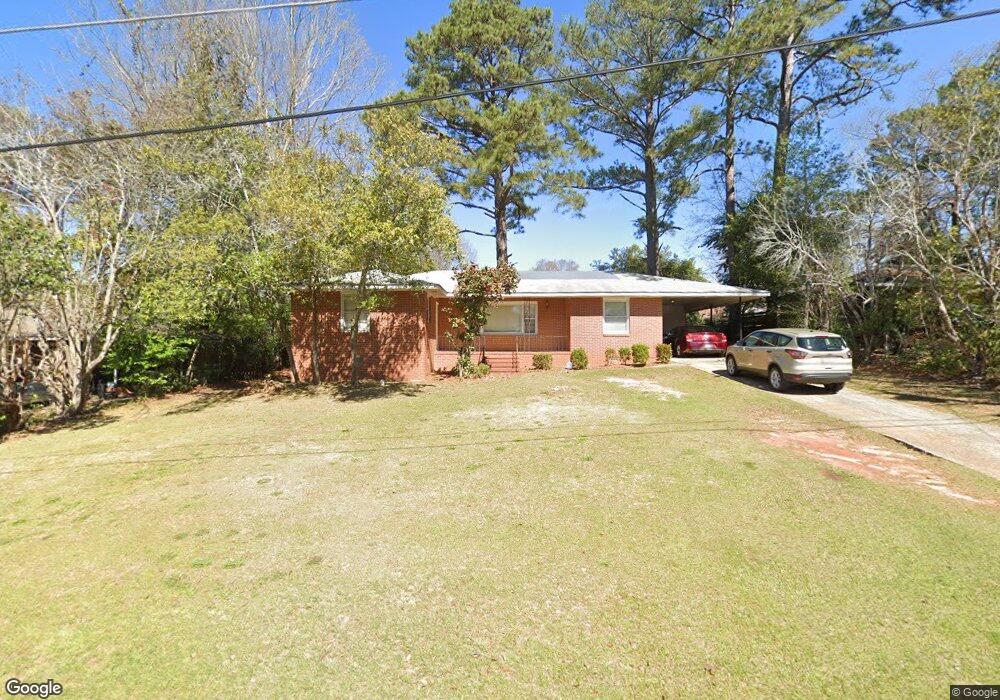
315 Draper St Warner Robins, GA 31088
Estimated Value: $154,000 - $179,000
3
Beds
2
Baths
1,481
Sq Ft
$111/Sq Ft
Est. Value
About This Home
This home is located at 315 Draper St, Warner Robins, GA 31088 and is currently estimated at $163,750, approximately $110 per square foot. 315 Draper St is a home located in Houston County with nearby schools including Miller Elementary School, Warner Robins Middle School, and Warner Robins High School.
Ownership History
Date
Name
Owned For
Owner Type
Purchase Details
Closed on
Aug 28, 2002
Sold by
Jones William H and Jones Rebecca
Bought by
Jones William H
Current Estimated Value
Purchase Details
Closed on
Mar 27, 1998
Sold by
Jones William H
Bought by
Jones William H and Jones Rebecca
Purchase Details
Closed on
Jun 20, 1996
Sold by
Uhl Alan W
Bought by
Jones William H
Purchase Details
Closed on
Jun 12, 1996
Sold by
Uhl Alan and Uhl Sloane K
Bought by
Uhl Alan W
Purchase Details
Closed on
Mar 30, 1989
Sold by
Windsor Jack G
Bought by
Uhl Alan and Uhl Sloane K
Purchase Details
Closed on
Jul 7, 1970
Sold by
Melvin James M
Bought by
Windsor Jack G
Purchase Details
Closed on
Dec 18, 1968
Sold by
Miller Alan D and Miller Rubye K
Bought by
Melvin James M
Purchase Details
Closed on
Oct 12, 1967
Sold by
Miller Alan D
Bought by
Miller Alan D and Miller Rubye K
Purchase Details
Closed on
Oct 5, 1961
Bought by
Miller Alan D
Create a Home Valuation Report for This Property
The Home Valuation Report is an in-depth analysis detailing your home's value as well as a comparison with similar homes in the area
Home Values in the Area
Average Home Value in this Area
Purchase History
| Date | Buyer | Sale Price | Title Company |
|---|---|---|---|
| Jones William H | -- | -- | |
| Jones William H | -- | -- | |
| Jones William H | $58,000 | -- | |
| Uhl Alan W | -- | -- | |
| Uhl Alan | -- | -- | |
| Windsor Jack G | -- | -- | |
| Melvin James M | -- | -- | |
| Miller Alan D | -- | -- | |
| Miller Alan D | -- | -- |
Source: Public Records
Tax History
| Year | Tax Paid | Tax Assessment Tax Assessment Total Assessment is a certain percentage of the fair market value that is determined by local assessors to be the total taxable value of land and additions on the property. | Land | Improvement |
|---|---|---|---|---|
| 2025 | $1,421 | $54,360 | $8,000 | $46,360 |
| 2024 | $1,504 | $47,360 | $6,000 | $41,360 |
| 2023 | $1,257 | $39,520 | $6,000 | $33,520 |
| 2022 | $773 | $35,600 | $6,000 | $29,600 |
| 2021 | $651 | $30,160 | $4,520 | $25,640 |
| 2020 | $626 | $28,960 | $4,520 | $24,440 |
| 2019 | $626 | $28,960 | $4,520 | $24,440 |
| 2018 | $626 | $28,960 | $4,520 | $24,440 |
| 2017 | $627 | $28,960 | $4,520 | $24,440 |
| 2016 | $628 | $28,960 | $4,520 | $24,440 |
| 2015 | -- | $28,960 | $4,520 | $24,440 |
| 2014 | -- | $28,960 | $4,520 | $24,440 |
| 2013 | -- | $28,960 | $4,520 | $24,440 |
Source: Public Records
Map
Nearby Homes
- 113 Sandra Ave
- 100 Brett Ave
- 101 Forest Hill Dr
- 110 Hillridge Dr
- 1012 Briarcliff Rd
- 213 Briarcliff Rd
- 104 Oxford Ln
- 213 Stratford Dr
- 104 Pleasant Hill Ct
- 306 Kingsbury Cir
- 207 Kingsway Dr
- 210 Granada Terrace
- 214 Kingsbury Cir
- 203 Springdale Dr
- 216 Randall Dr
- 110 Springdale Dr
- 271 Lakeshore Dr
- 100 Edgewood Ave
- 113 Vernon Dr
- 131 Cherokee Forest Trail
Your Personal Tour Guide
Ask me questions while you tour the home.