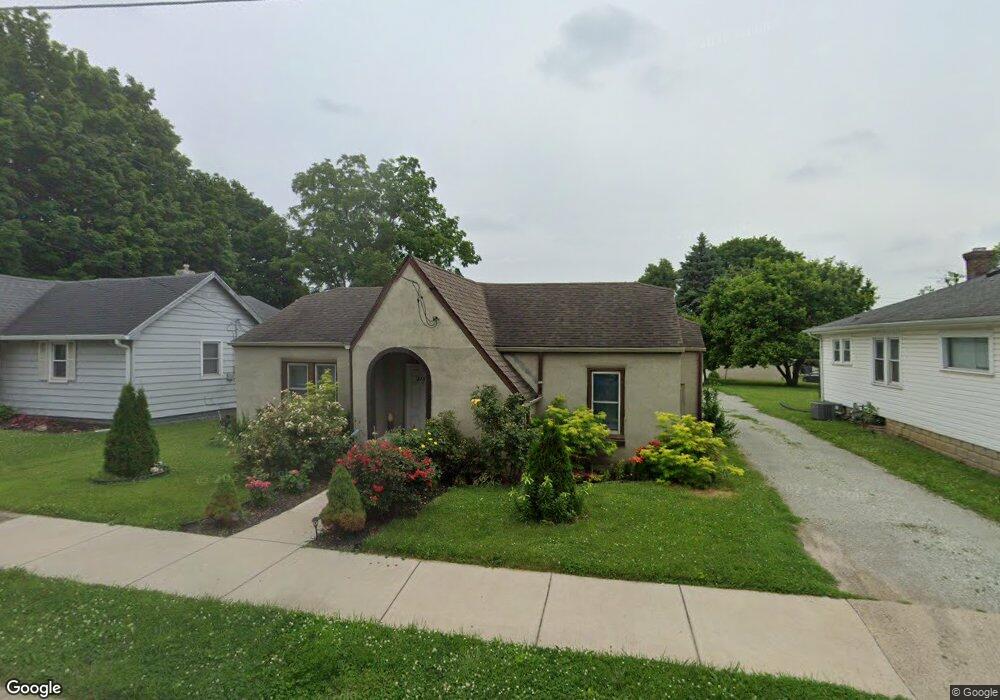
315 E 31st St Anderson, IN 46016
Estimated Value: $97,000 - $104,789
2
Beds
1
Bath
912
Sq Ft
$110/Sq Ft
Est. Value
About This Home
This home is located at 315 E 31st St, Anderson, IN 46016 and is currently estimated at $99,947, approximately $109 per square foot. 315 E 31st St is a home located in Madison County with nearby schools including Erskine Elementary School, Highland Middle School, and Anderson High School.
Ownership History
Date
Name
Owned For
Owner Type
Purchase Details
Closed on
Aug 17, 2021
Sold by
Talley Cynthia K and Talley Randy A
Bought by
Ingan Chona
Current Estimated Value
Home Financials for this Owner
Home Financials are based on the most recent Mortgage that was taken out on this home.
Original Mortgage
$58,200
Outstanding Balance
$52,463
Interest Rate
2.9%
Mortgage Type
New Conventional
Estimated Equity
$47,484
Purchase Details
Closed on
Dec 16, 2013
Sold by
Talley Randy A
Bought by
Talley Randy A and Talley Cynthia K
Purchase Details
Closed on
Dec 4, 2008
Sold by
Talley Randy A and Estate Of Robert L Talley
Bought by
Talley Randy A
Create a Home Valuation Report for This Property
The Home Valuation Report is an in-depth analysis detailing your home's value as well as a comparison with similar homes in the area
Home Values in the Area
Average Home Value in this Area
Purchase History
| Date | Buyer | Sale Price | Title Company |
|---|---|---|---|
| Ingan Chona | $60,000 | American Land Title | |
| Talley Randy A | -- | -- | |
| Talley Randy A | -- | -- |
Source: Public Records
Mortgage History
| Date | Status | Borrower | Loan Amount |
|---|---|---|---|
| Open | Ingan Chona | $58,200 |
Source: Public Records
Tax History
| Year | Tax Paid | Tax Assessment Tax Assessment Total Assessment is a certain percentage of the fair market value that is determined by local assessors to be the total taxable value of land and additions on the property. | Land | Improvement |
|---|---|---|---|---|
| 2025 | $587 | $60,000 | $7,900 | $52,100 |
| 2024 | $587 | $55,600 | $7,900 | $47,700 |
| 2023 | $542 | $51,300 | $7,600 | $43,700 |
| 2022 | $478 | $51,500 | $7,100 | $44,400 |
| 2021 | $453 | $47,000 | $7,000 | $40,000 |
| 2020 | $1,019 | $45,100 | $6,700 | $38,400 |
| 2019 | $1,457 | $44,200 | $6,700 | $37,500 |
| 2018 | $1,226 | $36,000 | $6,700 | $29,300 |
| 2017 | $718 | $35,900 | $6,700 | $29,200 |
| 2016 | $1,101 | $36,000 | $6,700 | $29,300 |
| 2014 | $694 | $34,700 | $6,700 | $28,000 |
| 2013 | $694 | $34,900 | $6,700 | $28,200 |
Source: Public Records
Map
Nearby Homes
- 3128 Fletcher St
- 2915 Central Ave
- 621 E 31st St
- 706 E 32nd St
- 711 E 32nd St
- 2639 Central Ave
- 321 E 34th St
- 2619 Meridian St
- 3004 Columbus Ave
- 3302 Columbus Ave
- 0 E Lynn St Unit MBR22081408
- 2519 Jackson St
- 2443 Meridian St
- 2803 E Lynn St
- 2328 Fletcher St
- 130 Elva St
- 2319 Pearl St
- 309 W 29th St
- 401 Elva St
- 2317 Fletcher St
Your Personal Tour Guide
Ask me questions while you tour the home.