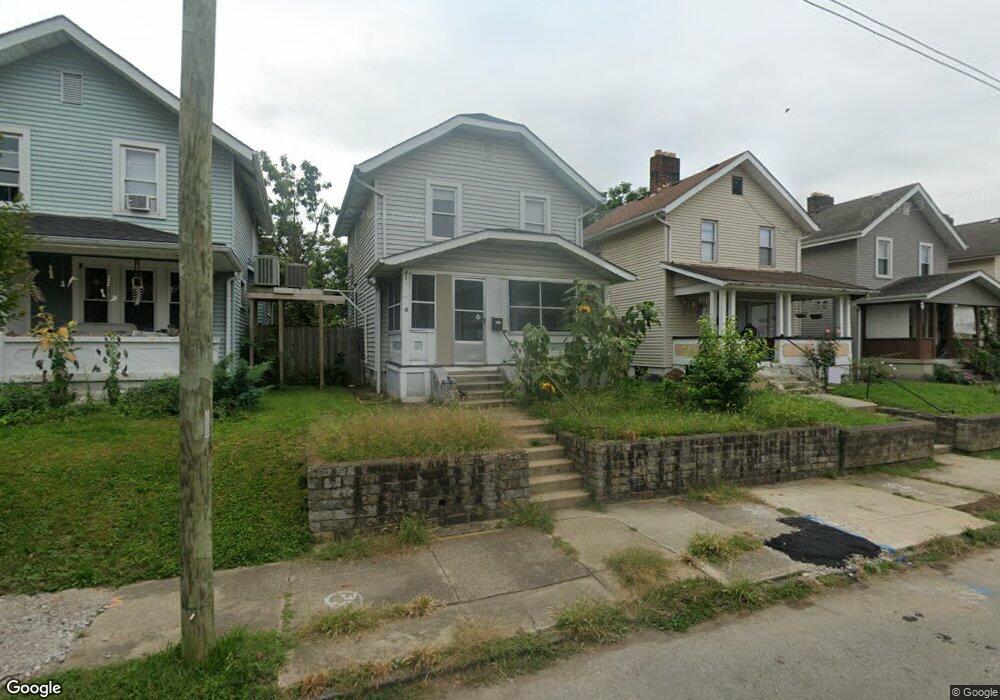
315 E Hinman Ave Columbus, OH 43207
Reeb-Hosack/Hungarian Village NeighborhoodEstimated Value: $198,576 - $240,000
2
Beds
2
Baths
1,034
Sq Ft
$221/Sq Ft
Est. Value
About This Home
This home is located at 315 E Hinman Ave, Columbus, OH 43207 and is currently estimated at $228,144, approximately $220 per square foot. 315 E Hinman Ave is a home located in Franklin County with nearby schools including Southwood Elementary School, South High School, and South Columbus Preparatory Academy.
Ownership History
Date
Name
Owned For
Owner Type
Purchase Details
Closed on
Jul 11, 2006
Sold by
Hud
Bought by
Hout David D
Current Estimated Value
Home Financials for this Owner
Home Financials are based on the most recent Mortgage that was taken out on this home.
Original Mortgage
$58,000
Outstanding Balance
$34,566
Interest Rate
6.72%
Mortgage Type
Purchase Money Mortgage
Estimated Equity
$193,578
Purchase Details
Closed on
Mar 6, 2006
Sold by
Lee Jared Michael and Washington Mutual Bank
Bought by
Hud
Purchase Details
Closed on
Oct 19, 1995
Sold by
Gollihue Gary L
Bought by
Jared Michael Lee and Jared Susan M
Home Financials for this Owner
Home Financials are based on the most recent Mortgage that was taken out on this home.
Original Mortgage
$63,950
Interest Rate
7.68%
Mortgage Type
New Conventional
Purchase Details
Closed on
Jan 27, 1989
Purchase Details
Closed on
Sep 1, 1983
Create a Home Valuation Report for This Property
The Home Valuation Report is an in-depth analysis detailing your home's value as well as a comparison with similar homes in the area
Home Values in the Area
Average Home Value in this Area
Purchase History
| Date | Buyer | Sale Price | Title Company |
|---|---|---|---|
| Hout David D | $48,000 | Lakeside | |
| Hud | $74,000 | None Available | |
| Jared Michael Lee | $63,900 | -- | |
| -- | $46,900 | -- | |
| -- | $28,900 | -- |
Source: Public Records
Mortgage History
| Date | Status | Borrower | Loan Amount |
|---|---|---|---|
| Open | Hout David D | $58,000 | |
| Previous Owner | Jared Michael Lee | $63,950 |
Source: Public Records
Tax History Compared to Growth
Tax History
| Year | Tax Paid | Tax Assessment Tax Assessment Total Assessment is a certain percentage of the fair market value that is determined by local assessors to be the total taxable value of land and additions on the property. | Land | Improvement |
|---|---|---|---|---|
| 2024 | $3,101 | $67,660 | $19,220 | $48,440 |
| 2023 | $3,216 | $71,050 | $19,215 | $51,835 |
| 2022 | $2,439 | $45,890 | $10,780 | $35,110 |
| 2021 | $2,443 | $45,890 | $10,780 | $35,110 |
| 2020 | $2,387 | $45,890 | $10,780 | $35,110 |
| 2019 | $1,943 | $32,030 | $7,980 | $24,050 |
| 2018 | $1,304 | $32,030 | $7,980 | $24,050 |
| 2017 | $1,942 | $32,030 | $7,980 | $24,050 |
| 2016 | $696 | $10,510 | $6,060 | $4,450 |
| 2015 | $669 | $10,510 | $6,060 | $4,450 |
| 2014 | $634 | $10,510 | $6,060 | $4,450 |
| 2013 | $349 | $10,500 | $6,055 | $4,445 |
Source: Public Records
Map
Nearby Homes
- 332 E Hinman Ave
- 314 E Woodrow Ave
- 1613 S 8th St
- 255 E Woodrow Ave
- 386 E Welch Ave
- 1696 Parsons Ave
- 1692 Parsons Ave
- 1676 Parsons Ave
- 1756 Bruck St
- 464 E Hinman Ave
- 472 E Hinman Ave
- 457 E Woodrow Ave Unit 459
- 466 E Morrill Ave
- 220 E Welch Ave
- 480-482 E Morrill Ave
- 361-363 Southwood Ave
- 323 Southwood Ave
- 391 Southwood Ave
- 495 E Welch Ave
- 1563 S 6th St
- 311 E Hinman Ave
- 319 E Hinman Ave
- 307 E Hinman Ave
- 325 E Hinman Ave
- 303 E Hinman Ave
- 327 E Hinman Ave
- 331 E Hinman Ave
- 297 E Hinman Ave
- 318 E Woodrow Ave
- 0 E Hinman Ave
- 310 E Woodrow Ave
- 335 E Hinman Ave
- 322 E Woodrow Ave
- 302 E Woodrow Ave
- 328 E Woodrow Ave
- 293 E Hinman Ave
- 318 E Hinman Ave
- 322 E Hinman Ave
- 339 E Hinman Ave
- 326 E Hinman Ave