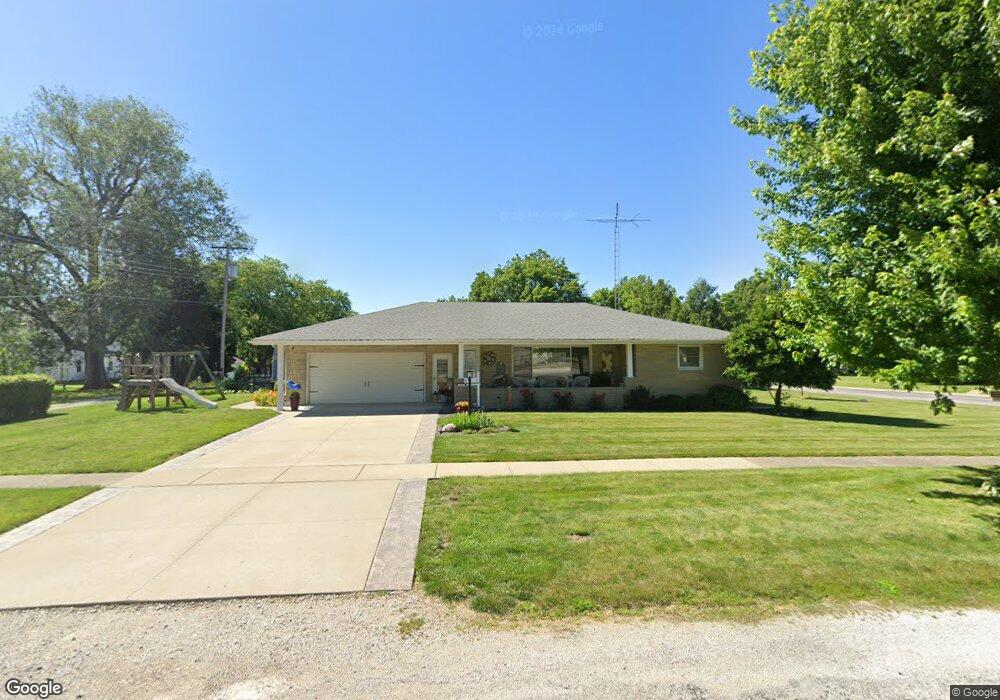
315 E South St Nokomis, IL 62075
Estimated Value: $117,819 - $177,000
Studio
--
Bath
1,224
Sq Ft
$117/Sq Ft
Est. Value
About This Home
This home is located at 315 E South St, Nokomis, IL 62075 and is currently estimated at $142,705, approximately $116 per square foot. 315 E South St is a home located in Montgomery County with nearby schools including North Elementary School, Nokomis Junior/Senior High School, and St. Louis Catholic School.
Ownership History
Date
Name
Owned For
Owner Type
Purchase Details
Closed on
Aug 19, 2007
Sold by
Tester Mary E and Tester Deloris L
Bought by
Keller James A and Keller Wendy A
Current Estimated Value
Home Financials for this Owner
Home Financials are based on the most recent Mortgage that was taken out on this home.
Original Mortgage
$122,956
Outstanding Balance
$78,286
Interest Rate
6.77%
Mortgage Type
Future Advance Clause Open End Mortgage
Estimated Equity
$64,419
Create a Home Valuation Report for This Property
The Home Valuation Report is an in-depth analysis detailing your home's value as well as a comparison with similar homes in the area
Purchase History
| Date | Buyer | Sale Price | Title Company |
|---|---|---|---|
| Keller James A | $92,500 | None Available |
Source: Public Records
Mortgage History
| Date | Status | Borrower | Loan Amount |
|---|---|---|---|
| Open | Keller James A | $122,956 |
Source: Public Records
Tax History
| Year | Tax Paid | Tax Assessment Tax Assessment Total Assessment is a certain percentage of the fair market value that is determined by local assessors to be the total taxable value of land and additions on the property. | Land | Improvement |
|---|---|---|---|---|
| 2024 | $2,206 | $36,360 | $7,010 | $29,350 |
| 2023 | $2,029 | $34,090 | $6,570 | $27,520 |
| 2022 | $1,953 | $32,760 | $6,310 | $26,450 |
| 2021 | $2,054 | $34,230 | $6,600 | $27,630 |
| 2020 | $2,372 | $32,650 | $6,290 | $26,360 |
| 2019 | $2,517 | $34,470 | $6,640 | $27,830 |
| 2018 | $2,415 | $32,450 | $6,250 | $26,200 |
| 2017 | $2,312 | $30,510 | $5,880 | $24,630 |
| 2016 | $2,308 | $29,670 | $5,720 | $23,950 |
| 2015 | $2,249 | $28,740 | $5,540 | $23,200 |
| 2013 | $2,180 | $29,090 | $5,600 | $23,490 |
Source: Public Records
Map
Nearby Homes
- 101 W South St
- 115 W South St
- 600 Sanford Ave
- 900 E Union St
- 304 N Spruce St
- 318 N Cedar St
- 507 N Spruce St
- 602 Herman St
- 416 Griffin St
- 245 S 7th St
- 185 Montgomery St
- Three Miles South of Nokomis
- 843 Monroe St
- 210 E Raymon Ave
- 638 E Ford Ave
- 529 N 2nd St
- 207 N 1st St
- 111 W Middleton St
- 104 N 6th St
- 17095 N 17th Ave
Your Personal Tour Guide
Ask me questions while you tour the home.