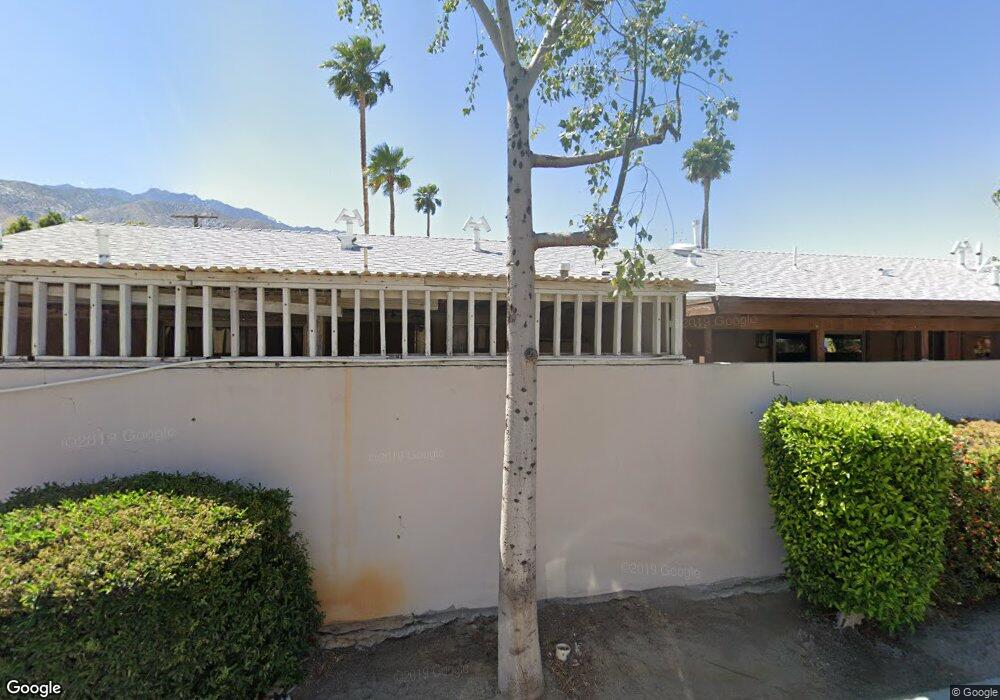
315 E Stevens Rd Unit 1 Palm Springs, CA 92262
El Mirador NeighborhoodEstimated Value: $119,000 - $315,000
1
Bed
2
Baths
750
Sq Ft
$299/Sq Ft
Est. Value
About This Home
This home is located at 315 E Stevens Rd Unit 1, Palm Springs, CA 92262 and is currently estimated at $224,088, approximately $298 per square foot. 315 E Stevens Rd Unit 1 is a home located in Riverside County with nearby schools including Katherine Finchy Elementary School, Raymond Cree Middle School, and Palm Springs High School.
Ownership History
Date
Name
Owned For
Owner Type
Purchase Details
Closed on
Oct 8, 2024
Sold by
Lisa Locker Llc
Bought by
Vea Sara Olivia Ruela
Current Estimated Value
Home Financials for this Owner
Home Financials are based on the most recent Mortgage that was taken out on this home.
Original Mortgage
$115,000
Outstanding Balance
$113,756
Interest Rate
6.2%
Mortgage Type
New Conventional
Estimated Equity
$110,332
Purchase Details
Closed on
May 12, 2011
Sold by
Chimienti Rick D
Bought by
Locker Lisa
Purchase Details
Closed on
May 25, 2006
Sold by
Daniel Larraine and Daniel Lorraine
Bought by
Chimienti Rick D
Home Financials for this Owner
Home Financials are based on the most recent Mortgage that was taken out on this home.
Original Mortgage
$133,000
Interest Rate
7.95%
Mortgage Type
Purchase Money Mortgage
Purchase Details
Closed on
Jul 14, 2001
Sold by
Daniel William
Bought by
Daniel Lorraine
Create a Home Valuation Report for This Property
The Home Valuation Report is an in-depth analysis detailing your home's value as well as a comparison with similar homes in the area
Home Values in the Area
Average Home Value in this Area
Purchase History
| Date | Buyer | Sale Price | Title Company |
|---|---|---|---|
| Vea Sara Olivia Ruela | $115,000 | Orange Coast Title | |
| Locker Lisa | $29,500 | Fnt Ie | |
| Chimienti Rick D | -- | Gateway Title Ins Co | |
| Daniel Lorraine | -- | -- |
Source: Public Records
Mortgage History
| Date | Status | Borrower | Loan Amount |
|---|---|---|---|
| Open | Vea Sara Olivia Ruela | $115,000 | |
| Previous Owner | Chimienti Rick D | $133,000 |
Source: Public Records
Tax History
| Year | Tax Paid | Tax Assessment Tax Assessment Total Assessment is a certain percentage of the fair market value that is determined by local assessors to be the total taxable value of land and additions on the property. | Land | Improvement |
|---|---|---|---|---|
| 2025 | $700 | $115,000 | $60,000 | $55,000 |
| 2023 | $700 | $35,602 | $8,444 | $27,158 |
| 2022 | $700 | $34,905 | $8,279 | $26,626 |
| 2021 | $691 | $34,221 | $8,117 | $26,104 |
| 2020 | $670 | $33,871 | $8,034 | $25,837 |
| 2019 | $663 | $33,208 | $7,877 | $25,331 |
| 2018 | $655 | $32,558 | $7,723 | $24,835 |
| 2017 | $649 | $31,921 | $7,572 | $24,349 |
| 2016 | $637 | $31,296 | $7,424 | $23,872 |
| 2015 | $599 | $30,827 | $7,313 | $23,514 |
| 2014 | $572 | $30,225 | $7,171 | $23,054 |
Source: Public Records
Map
Nearby Homes
- 314 E Stevens Rd Unit 14
- 435 E Chuckwalla Rd
- 1555 N Chaparral Rd Unit 323
- 1555 N Chaparral Rd Unit 328
- 1555 N Chaparral Rd Unit 334
- 1555 N Chaparral Rd Unit 402
- 1339 N Indian Canyon Dr
- 401 E Vista Chino Unit 6
- 291 E Mel Ave Unit 200
- 291 E Mel Ave Unit 232
- 1433 N Fiesta Rd
- 246 W Vereda Norte
- 240 W Stevens Rd
- 1725 N Via Miraleste Unit 2111
- 1725 N Via Miraleste Unit 2125
- 1725 N Via Miraleste Unit 2121
- 1735 N Via Miraleste Unit 1921
- 1735 N Via Miraleste Unit 1924
- 1785 N Via Miraleste Unit 1721
- 2400 Bisnaga
- 315 E Stevens Rd Unit 7
- 315 E Stevens Rd Unit 6
- 315 E Stevens Rd Unit 5
- 315 E Stevens Rd Unit 4
- 315 E Stevens Rd Unit 3
- 315 E Stevens Rd Unit 2
- 277 E Stevens Rd Unit Mult
- 277 E Stevens Rd Unit 1
- 277 E Stevens Rd Unit 2
- 277 E Stevens Rd
- 312 E Camino Monte Vista
- 288 E Camino Monte Vista
- 1420 N Indian Canyon Dr
- 314 E Stevens Rd Unit 11
- 314 E Stevens Rd Unit 15
- 314 E Stevens Rd Unit 12
- 314 E Stevens Rd
- 314 E Stevens Rd Unit 5
- 314 E Stevens Rd Unit 8
- 314 E Stevens Rd Unit 7
Your Personal Tour Guide
Ask me questions while you tour the home.