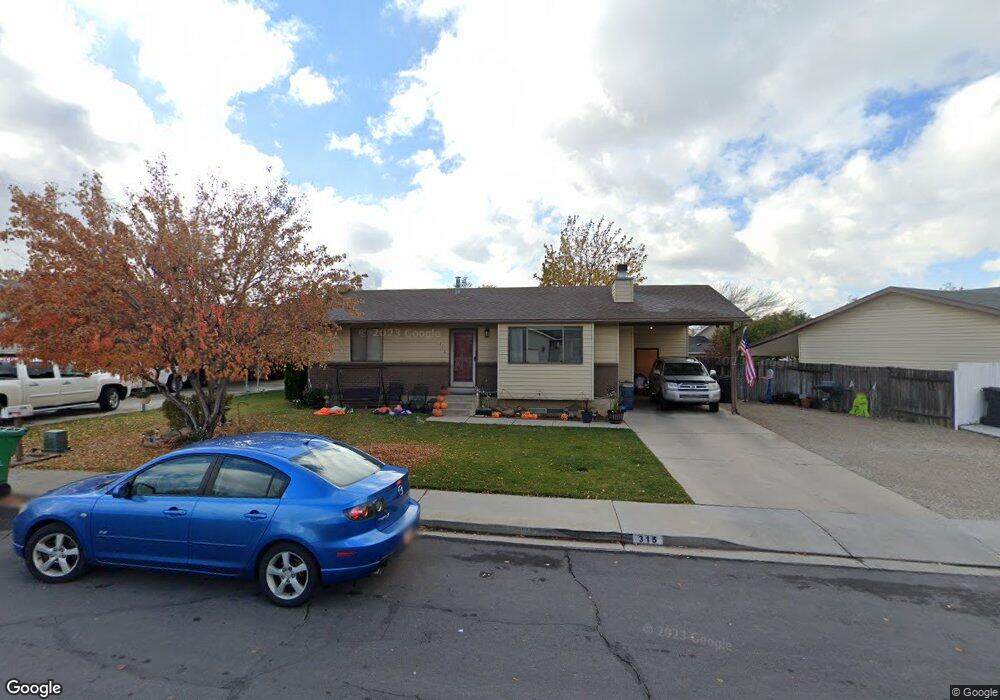
315 Foxmoor Dr Orem, UT 84057
Geneva NeighborhoodEstimated Value: $457,000 - $527,000
2
Beds
2
Baths
1,122
Sq Ft
$438/Sq Ft
Est. Value
About This Home
This home is located at 315 Foxmoor Dr, Orem, UT 84057 and is currently estimated at $491,553, approximately $438 per square foot. 315 Foxmoor Dr is a home located in Utah County with nearby schools including Orem Junior High School, Timpanogos High School, and Noah Webster Academy.
Ownership History
Date
Name
Owned For
Owner Type
Purchase Details
Closed on
Feb 18, 2010
Sold by
Davies Brad J and Davies Mary C
Bought by
Weatherly Jared P and Weatherly Rebecca B
Current Estimated Value
Home Financials for this Owner
Home Financials are based on the most recent Mortgage that was taken out on this home.
Original Mortgage
$181,354
Outstanding Balance
$122,814
Interest Rate
5.5%
Mortgage Type
FHA
Estimated Equity
$368,739
Purchase Details
Closed on
Feb 22, 2000
Sold by
Ericksen Thomas M and Ericksen Michele
Bought by
Davies Brad J and Davies Mary C
Home Financials for this Owner
Home Financials are based on the most recent Mortgage that was taken out on this home.
Original Mortgage
$132,952
Interest Rate
8.16%
Mortgage Type
FHA
Purchase Details
Closed on
Jan 2, 1997
Sold by
Ericksen Thomas M
Bought by
Ericksen Thomas M and Ericksen Michele
Create a Home Valuation Report for This Property
The Home Valuation Report is an in-depth analysis detailing your home's value as well as a comparison with similar homes in the area
Home Values in the Area
Average Home Value in this Area
Purchase History
| Date | Buyer | Sale Price | Title Company |
|---|---|---|---|
| Weatherly Jared P | -- | Old Republic Title Company | |
| Davies Brad J | -- | Guardian Title Insurance | |
| Ericksen Thomas M | -- | -- |
Source: Public Records
Mortgage History
| Date | Status | Borrower | Loan Amount |
|---|---|---|---|
| Open | Weatherly Jared P | $181,354 | |
| Previous Owner | Davies Brad J | $132,952 | |
| Closed | Davies Brad J | $5,000 |
Source: Public Records
Tax History
| Year | Tax Paid | Tax Assessment Tax Assessment Total Assessment is a certain percentage of the fair market value that is determined by local assessors to be the total taxable value of land and additions on the property. | Land | Improvement |
|---|---|---|---|---|
| 2025 | $1,846 | $237,435 | -- | -- |
| 2024 | $1,846 | $225,775 | $0 | $0 |
| 2023 | $1,706 | $224,235 | $0 | $0 |
| 2022 | $1,758 | $223,795 | $0 | $0 |
| 2021 | $1,630 | $314,400 | $108,600 | $205,800 |
| 2020 | $1,513 | $286,700 | $86,900 | $199,800 |
| 2019 | $1,361 | $268,200 | $86,900 | $181,300 |
| 2018 | $1,342 | $252,800 | $83,500 | $169,300 |
| 2017 | $1,210 | $122,045 | $0 | $0 |
| 2016 | $1,220 | $113,465 | $0 | $0 |
| 2015 | $1,189 | $104,610 | $0 | $0 |
| 2014 | $1,150 | $100,705 | $0 | $0 |
Source: Public Records
Map
Nearby Homes
- 597 N State St Unit 25
- 243 W 310 North St
- 285 N 300 W
- 241 W 310 St N
- 125 W 870 N
- 33 W 400 N
- 223 N 360 W
- 369 N Main St Unit 2
- 196 N 400 W
- 277 W Garden Park Dr
- 162 N 450 W Unit 2
- 512 N 100 E
- 489 N Beverly Ave
- 241 W Garden Park
- 620 N 120 E
- 16 E 925 N
- 208 W Garden Park
- 803 W 530 N
- 686 N 835 W
- 62 N 380 W
Your Personal Tour Guide
Ask me questions while you tour the home.