Estimated Value: $967,477 - $1,430,000
2
Beds
1
Bath
1,113
Sq Ft
$1,085/Sq Ft
Est. Value
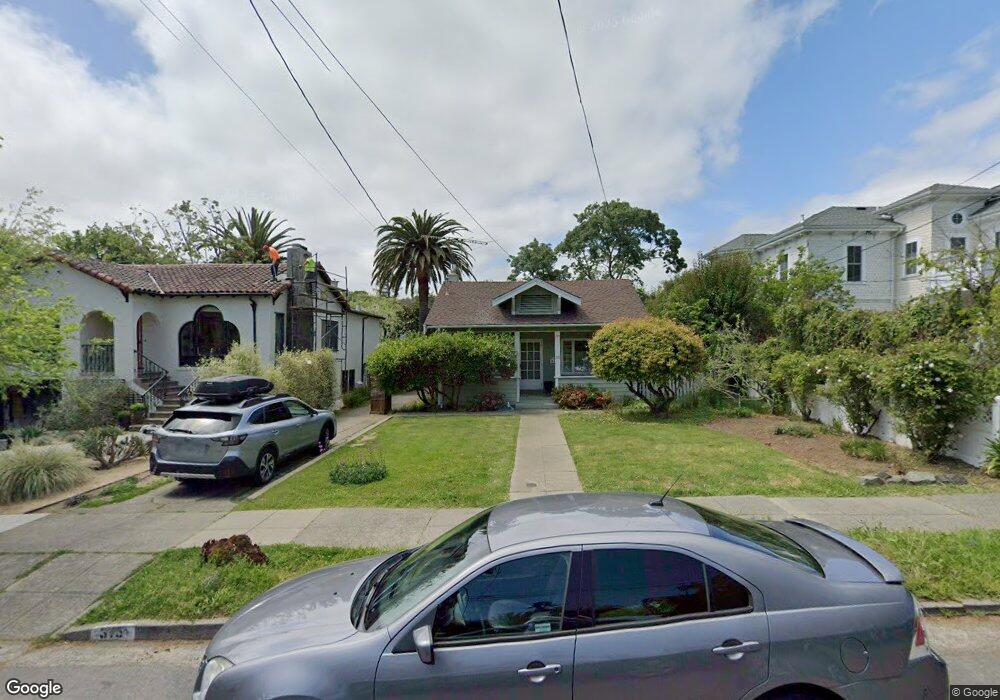
About This Home
This home is located at 315 G St, San Rafael, CA 94901 and is currently estimated at $1,207,619, approximately $1,085 per square foot. 315 G St is a home located in Marin County with nearby schools including Sun Valley Elementary School, James B. Davidson Middle School, and San Rafael High School.
Ownership History
Date
Name
Owned For
Owner Type
Purchase Details
Closed on
Nov 15, 2018
Sold by
Garbarino Joseph J and The Joseph And Sally Garbarino
Bought by
Garbarjno Investments Ii Lp
Current Estimated Value
Purchase Details
Closed on
Nov 8, 2018
Sold by
Garbarino Joseph J and Garbarino Joseph
Bought by
Garbarino Patricia D and Rosa Judith A
Purchase Details
Closed on
Nov 17, 2008
Sold by
Garbarino Joseph J and Garbarino Sally Gwen
Bought by
J & S G Properties Lp
Create a Home Valuation Report for This Property
The Home Valuation Report is an in-depth analysis detailing your home's value as well as a comparison with similar homes in the area
Home Values in the Area
Average Home Value in this Area
Purchase History
| Date | Buyer | Sale Price | Title Company |
|---|---|---|---|
| Garbarjno Investments Ii Lp | -- | None Available | |
| Garbarino Patricia D | -- | None Available | |
| Gararino Joseph J | -- | None Available | |
| J & S G Properties Lp | -- | None Available |
Source: Public Records
Tax History
| Year | Tax Paid | Tax Assessment Tax Assessment Total Assessment is a certain percentage of the fair market value that is determined by local assessors to be the total taxable value of land and additions on the property. | Land | Improvement |
|---|---|---|---|---|
| 2025 | $5,979 | $308,693 | $150,203 | $158,490 |
| 2024 | $5,672 | $302,640 | $147,258 | $155,382 |
| 2023 | $5,512 | $296,707 | $144,371 | $152,336 |
| 2022 | $5,264 | $290,891 | $141,541 | $149,350 |
| 2021 | $5,182 | $285,186 | $138,765 | $146,421 |
| 2020 | $5,092 | $282,251 | $137,337 | $144,914 |
| 2019 | $4,885 | $276,718 | $134,645 | $142,073 |
| 2018 | $4,831 | $271,293 | $132,005 | $139,288 |
| 2017 | $4,672 | $265,974 | $129,417 | $136,557 |
| 2016 | $4,500 | $260,760 | $126,880 | $133,880 |
| 2015 | $4,306 | $256,843 | $124,974 | $131,869 |
| 2014 | $4,108 | $251,812 | $122,526 | $129,286 |
Source: Public Records
Map
Nearby Homes
- 1836 5th Ave
- 39 Latham St
- 51 El Camino Ave
- 1851 2nd St
- 11 Jessup St
- 138 Miramar Ave
- 59, 60 Clayton St
- 29 Frances St
- 717 C St
- 92 Elizabeth Way
- 619 B St
- 226 Bayview St
- 20 Taylor St
- 119 Oakmont Ave
- 77 Coleman Dr
- 823 Mission Ave
- 820 Mission Ave Unit 7
- 1422 Nye St
- 0 Coleman Dr Unit 326011947
- 0 Coleman Dr Unit 325060705
Your Personal Tour Guide
Ask me questions while you tour the home.