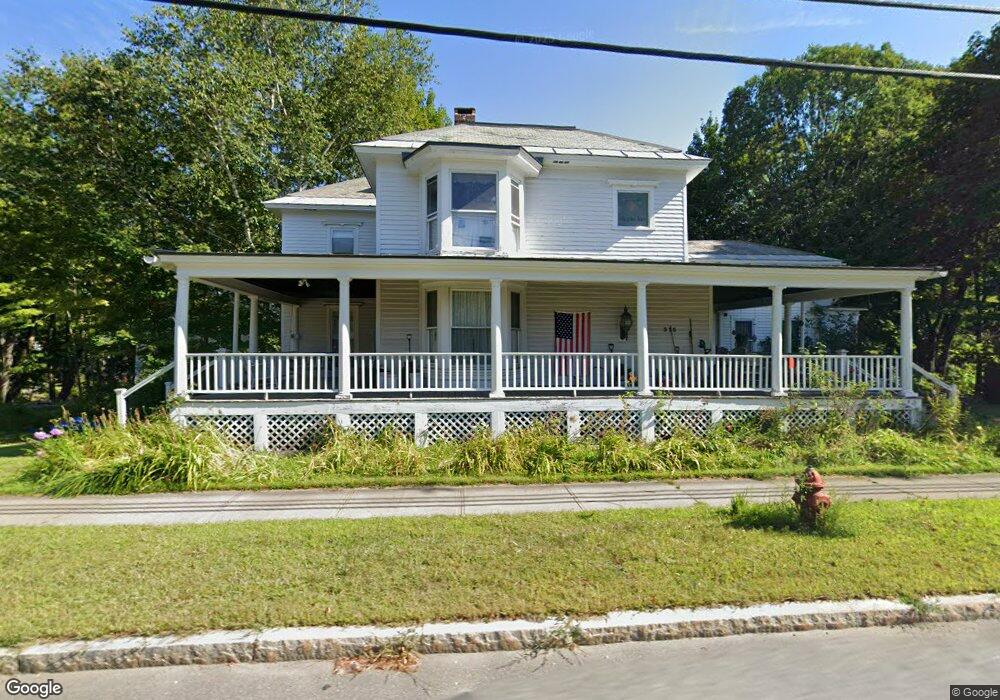
315 Main St Ashfield, MA 01330
Ashfield NeighborhoodEstimated Value: $432,000 - $591,000
5
Beds
2
Baths
3,114
Sq Ft
$153/Sq Ft
Est. Value
About This Home
This home is located at 315 Main St, Ashfield, MA 01330 and is currently estimated at $476,782, approximately $153 per square foot. 315 Main St is a home located in Franklin County with nearby schools including Mohawk Trail Regional High School.
Ownership History
Date
Name
Owned For
Owner Type
Purchase Details
Closed on
May 23, 2007
Sold by
Satterfield Carl W
Bought by
Indenture Ret
Current Estimated Value
Purchase Details
Closed on
Sep 18, 2003
Sold by
Dubour Donna L
Bought by
Satterfield Carl W
Home Financials for this Owner
Home Financials are based on the most recent Mortgage that was taken out on this home.
Original Mortgage
$144,000
Interest Rate
6.31%
Mortgage Type
Purchase Money Mortgage
Create a Home Valuation Report for This Property
The Home Valuation Report is an in-depth analysis detailing your home's value as well as a comparison with similar homes in the area
Home Values in the Area
Average Home Value in this Area
Purchase History
| Date | Buyer | Sale Price | Title Company |
|---|---|---|---|
| Indenture Ret | -- | -- | |
| Satterfield Carl W | $180,000 | -- |
Source: Public Records
Mortgage History
| Date | Status | Borrower | Loan Amount |
|---|---|---|---|
| Previous Owner | Satterfield Carl W | $144,000 | |
| Previous Owner | Satterfield Carl W | $50,000 | |
| Previous Owner | Satterfield Carl W | $108,000 | |
| Previous Owner | Satterfield Carl W | $99,999 |
Source: Public Records
Tax History Compared to Growth
Tax History
| Year | Tax Paid | Tax Assessment Tax Assessment Total Assessment is a certain percentage of the fair market value that is determined by local assessors to be the total taxable value of land and additions on the property. | Land | Improvement |
|---|---|---|---|---|
| 2025 | $5,790 | $430,200 | $71,500 | $358,700 |
| 2024 | $5,845 | $400,100 | $71,500 | $328,600 |
| 2023 | $5,616 | $318,900 | $57,200 | $261,700 |
| 2022 | $5,256 | $302,400 | $54,400 | $248,000 |
| 2021 | $4,856 | $293,400 | $54,400 | $239,000 |
| 2020 | $4,888 | $293,400 | $54,400 | $239,000 |
| 2019 | $4,506 | $262,600 | $50,800 | $211,800 |
| 2018 | $4,439 | $258,400 | $50,800 | $207,600 |
| 2017 | $4,180 | $257,700 | $50,100 | $207,600 |
| 2016 | $3,960 | $240,900 | $50,100 | $190,800 |
| 2015 | $3,847 | $240,900 | $50,100 | $190,800 |
| 2014 | $3,964 | $245,300 | $47,200 | $198,100 |
Source: Public Records
Map
Nearby Homes
- 240 Beldingville Rd
- 220 Hawley Rd
- 374 Watson Spruce Corner Rd
- 0 Ashfield Rd
- 473 N Poland Rd
- 0 Old Stage Rd Unit 73326639
- 0 Sears Rd Unit 73373850
- 0 John Ford Rd Unit 73403157
- 0 John Ford Rd Unit 73403156
- lot 1 Shelburne Falls Rd
- 85 Dacey Rd
- 1531 Williamsburg Rd
- 0 Upper St
- 0 Spruce Corner Rd Unit 73244975
- 333 Ranney Corner Rd
- 230 S Ashfield Rd
- 7 Hog Hollow Rd
- 156 Ashfield Rd
- 41 Buckland Rd
- 0 Pleasant St