Estimated Value: $134,000 - $169,000
--
Bed
--
Bath
1,156
Sq Ft
$128/Sq Ft
Est. Value
About This Home
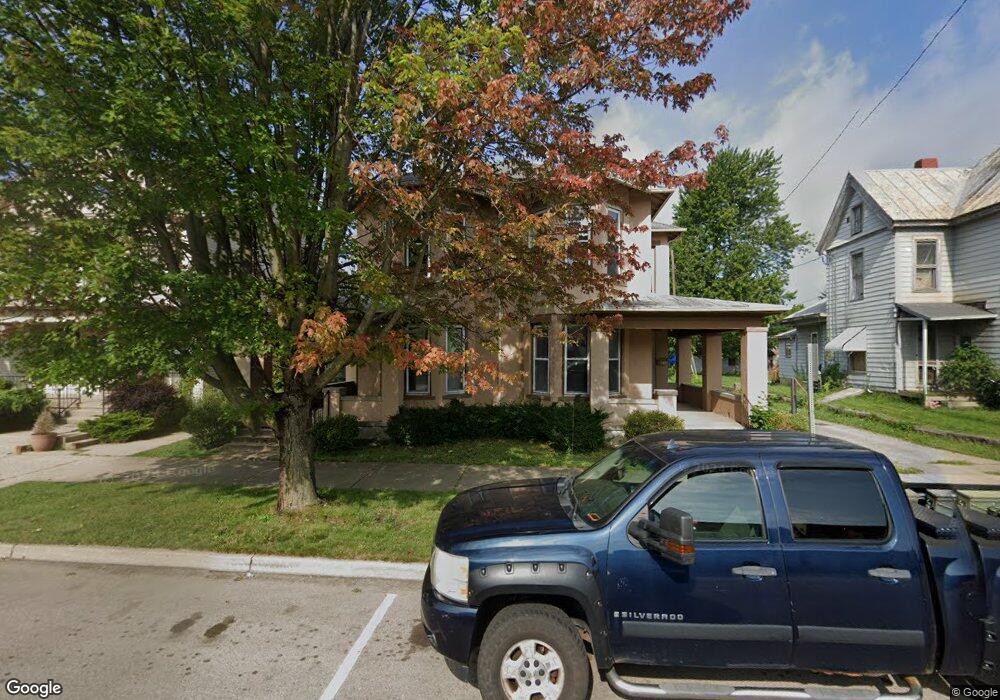
This home is located at 315 N Barron St, Eaton, OH 45320 and is currently estimated at $147,646, approximately $127 per square foot. 315 N Barron St is a home with nearby schools including Hollingsworth East Elementary School, William Bruce Elementary School, and Eaton Middle School.
Ownership History
Date
Name
Owned For
Owner Type
Purchase Details
Closed on
Feb 1, 2023
Sold by
Roth Ron and Roth Ginger
Bought by
Wolfe Robert E
Current Estimated Value
Home Financials for this Owner
Home Financials are based on the most recent Mortgage that was taken out on this home.
Original Mortgage
$100,500
Outstanding Balance
$93,431
Interest Rate
6.27%
Mortgage Type
New Conventional
Estimated Equity
$54,215
Purchase Details
Closed on
Nov 1, 2021
Sold by
Roth Ron and Roth Ginger
Bought by
Wolfe Robert E
Home Financials for this Owner
Home Financials are based on the most recent Mortgage that was taken out on this home.
Original Mortgage
$103,000
Interest Rate
5%
Mortgage Type
Land Contract Argmt. Of Sale
Purchase Details
Closed on
Jan 11, 2013
Sold by
Daily Investments
Bought by
Roth Ron and Roth Ginger
Purchase Details
Closed on
May 31, 1995
Sold by
Gade Richard E
Bought by
Daily Investments
Purchase Details
Closed on
Jul 6, 1994
Sold by
Hatch Richard H
Bought by
Gade Richard P and Gade Richard
Create a Home Valuation Report for This Property
The Home Valuation Report is an in-depth analysis detailing your home's value as well as a comparison with similar homes in the area
Home Values in the Area
Average Home Value in this Area
Purchase History
| Date | Buyer | Sale Price | Title Company |
|---|---|---|---|
| Wolfe Robert E | -- | -- | |
| Wolfe Robert E | -- | None Listed On Document | |
| Wolfe Robert E | $105,000 | None Available | |
| Roth Ron | $95,000 | None Available | |
| Daily Investments | $72,000 | -- | |
| Gade Richard P | $56,000 | -- |
Source: Public Records
Mortgage History
| Date | Status | Borrower | Loan Amount |
|---|---|---|---|
| Open | Wolfe Robert E | $100,500 | |
| Closed | Wolfe Robert E | $100,500 | |
| Previous Owner | Wolfe Robert E | $103,000 |
Source: Public Records
Tax History Compared to Growth
Tax History
| Year | Tax Paid | Tax Assessment Tax Assessment Total Assessment is a certain percentage of the fair market value that is determined by local assessors to be the total taxable value of land and additions on the property. | Land | Improvement |
|---|---|---|---|---|
| 2024 | $1,335 | $33,390 | $12,600 | $20,790 |
| 2023 | $1,335 | $33,390 | $12,600 | $20,790 |
| 2022 | $1,212 | $25,380 | $10,500 | $14,880 |
| 2021 | $1,290 | $25,380 | $10,500 | $14,880 |
| 2020 | $1,221 | $25,380 | $10,500 | $14,880 |
| 2019 | $1,221 | $25,380 | $10,500 | $14,880 |
| 2018 | $1,282 | $25,380 | $10,500 | $14,880 |
| 2017 | $1,240 | $25,380 | $10,500 | $14,880 |
| 2016 | $1,203 | $24,890 | $8,650 | $16,240 |
| 2014 | $1,204 | $24,890 | $8,650 | $16,240 |
| 2013 | $1,204 | $24,885 | $8,645 | $16,240 |
Source: Public Records
Map
Nearby Homes
- 111 W High St
- 233 N Barron St
- 125 E Decatur St
- 0-00 Washington Jackson Rd
- 219 E High St
- 124 Deem St
- 405 Walnut St
- 414 N Maple St
- 612 N Cherry St
- 117 Vine St
- 422 Lexington Ave
- 210 W Spring St
- 230 W Spring St
- 919 N Barron St
- 1008 N Maple St
- 105 Leatherman Place
- 331 W Chicago St
- 301 E Saint Clair St
- 1119 N Maple St
- 219 Nation Ave
- 317 N Barron St
- 309 N Barron St
- 317 1/2 N Barron St
- 323 N Barron St
- 300 N Barron St
- 325 N Barron St
- 327 N Barron St
- 306 N Barron St
- 116 W Decatur St
- 314 N Beech St
- 119 W High St
- 110 E Decatur St
- 227 N Barron St
- 122 W Decatur St
- 318 N Beech St
- 401 N Barron St
- 114 E Decatur St
- 320 N Beech St
- 112 W High St
- 125 W High St