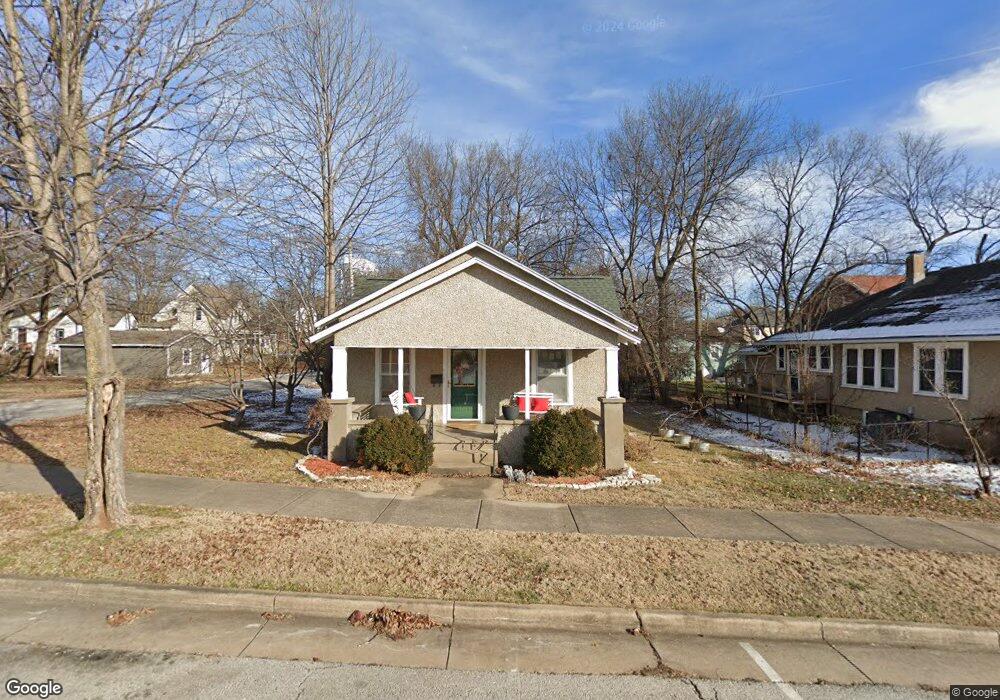
315 N Broadway St Siloam Springs, AR 72761
Estimated Value: $165,913 - $198,000
2
Beds
1
Bath
1,002
Sq Ft
$178/Sq Ft
Est. Value
About This Home
This home is located at 315 N Broadway St, Siloam Springs, AR 72761 and is currently estimated at $177,978, approximately $177 per square foot. 315 N Broadway St is a home located in Benton County with nearby schools including Northside Elementary School, Delbert Pete & Pat Allen Elementary School, and Southside Elementary School.
Ownership History
Date
Name
Owned For
Owner Type
Purchase Details
Closed on
Apr 26, 2017
Sold by
Letellier Casey D
Bought by
Manos Traci
Current Estimated Value
Purchase Details
Closed on
Jun 22, 2010
Sold by
Selby Chris
Bought by
Letellier Casey D and Letellier Traci R
Home Financials for this Owner
Home Financials are based on the most recent Mortgage that was taken out on this home.
Original Mortgage
$70,466
Interest Rate
4.77%
Mortgage Type
New Conventional
Purchase Details
Closed on
Jun 20, 2003
Bought by
Selby
Purchase Details
Closed on
Sep 18, 1999
Bought by
Dod 09-18-1999
Purchase Details
Closed on
Apr 18, 1996
Bought by
Selby Fam Rev Tr
Purchase Details
Closed on
Apr 17, 1996
Bought by
Selby Family Rev Trust
Purchase Details
Closed on
Aug 20, 1991
Bought by
Selby
Purchase Details
Closed on
Feb 20, 1991
Bought by
Springston
Create a Home Valuation Report for This Property
The Home Valuation Report is an in-depth analysis detailing your home's value as well as a comparison with similar homes in the area
Home Values in the Area
Average Home Value in this Area
Purchase History
| Date | Buyer | Sale Price | Title Company |
|---|---|---|---|
| Manos Traci | -- | Waco Title Company | |
| Letellier Casey D | $69,000 | Stewart Title Of Ar Inc | |
| Selby | $54,000 | -- | |
| Dod 09-18-1999 | -- | -- | |
| Selby Fam Rev Tr | -- | -- | |
| Selby Family Rev Trust | -- | -- | |
| Selby | $32,000 | -- | |
| Springston | -- | -- |
Source: Public Records
Mortgage History
| Date | Status | Borrower | Loan Amount |
|---|---|---|---|
| Previous Owner | Letellier Casey D | $70,466 |
Source: Public Records
Tax History Compared to Growth
Tax History
| Year | Tax Paid | Tax Assessment Tax Assessment Total Assessment is a certain percentage of the fair market value that is determined by local assessors to be the total taxable value of land and additions on the property. | Land | Improvement |
|---|---|---|---|---|
| 2025 | $878 | $23,474 | $7,400 | $16,074 |
| 2024 | $860 | $23,474 | $7,400 | $16,074 |
| 2023 | $819 | $17,060 | $5,600 | $11,460 |
| 2022 | $408 | $17,060 | $5,600 | $11,460 |
| 2021 | $370 | $17,060 | $5,600 | $11,460 |
| 2020 | $337 | $12,360 | $5,600 | $6,760 |
| 2019 | $337 | $12,360 | $5,600 | $6,760 |
| 2018 | $712 | $12,360 | $5,600 | $6,760 |
| 2017 | $362 | $12,360 | $5,600 | $6,760 |
| 2016 | $362 | $12,360 | $5,600 | $6,760 |
| 2015 | $680 | $11,800 | $1,600 | $10,200 |
| 2014 | $330 | $11,800 | $1,600 | $10,200 |
Source: Public Records
Map
Nearby Homes
- 414 N Maxwell St
- 517 N Madison St
- 503 N Wright St
- 210 E Ashley St
- 517 N Wright St
- 0 Tbd St Andrews
- 605 N Wright St
- 403 E University St
- 506 E Ashley St
- 716 N Mount Olive St
- 411 N Maple St
- 111 E Helena St
- 101 E Central St
- TBD South N Elm St
- 0000 N Elm St
- 114 S College St
- 110 N Gunter St
- 730 N Walnut Ct
- 402 Greenwood
- 607 E Delaware St
- 311 N Broadway St
- 320 N Maxwell St
- 316 N Maxwell St
- 400 N Broadway St
- 201 E Ashley St
- 407 N Broadway St
- 302 N Maxwell St
- Lot 2 St Andrews
- 0 Siloam Place
- 408 N Maxwell St
- 0 Tract 41 Grace Estates Unit 555971
- 0 Tract 41 Unit 716411
- 300 E Benton St Unit 300 302
- 300 E Benton St
- 302 E Benton St
- 411 N Broadway St
- 315 N Maxwell St
- 400 N Broadway St
- 401 N Maxwell St
- 0 Maxwell St Unit 528931