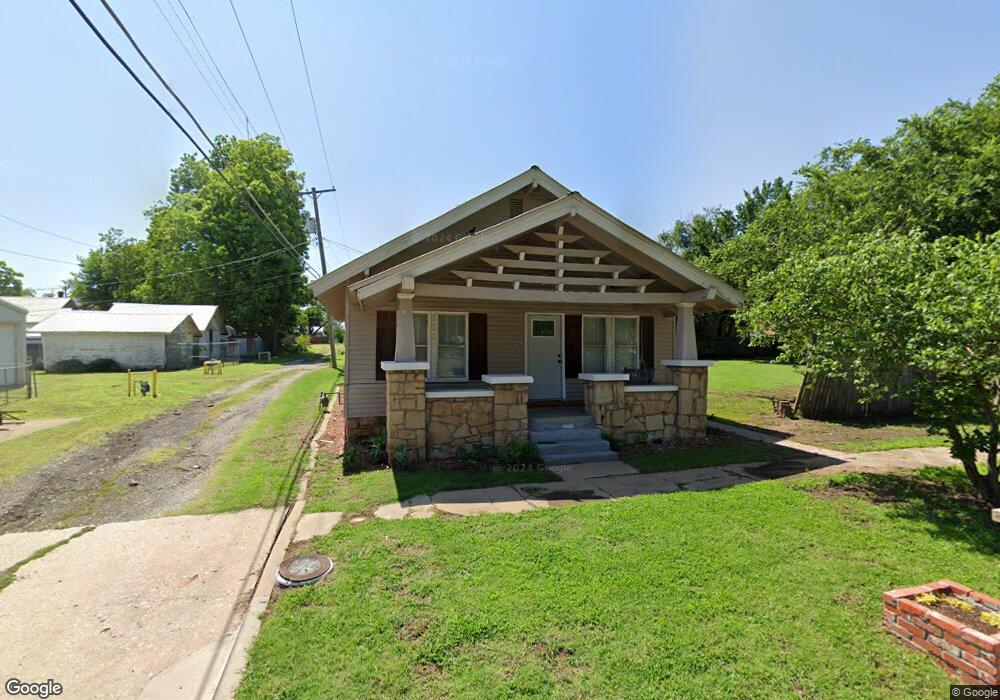
315 N East Ave Cushing, OK 74023
Estimated Value: $81,000 - $85,682
About This Home
This home is located at 315 N East Ave, Cushing, OK 74023 and is currently estimated at $83,421, approximately $85 per square foot. 315 N East Ave is a home located in Payne County with nearby schools including Cushing Upper Elementary School, Cushing Lower Elementary School, and Cushing High School.
Ownership History
We collect this data history from publicly available records. To have your information removed, we recommend requesting removal directly through your county’s website.
Purchase Details
Purchase Details
Home Financials for this Owner
Home Financials are based on the most recent Mortgage that was taken out on this home.Purchase Details
Purchase History
We collect this data history from publicly available records. To have your information removed, we recommend requesting removal directly through your county’s website.
| Date | Buyer | Sale Price | Title Company |
|---|---|---|---|
| -- | None Available | ||
| $39,000 | None Available | ||
| -- | None Available |
Mortgage History
We collect this data history from publicly available records. To have your information removed, we recommend requesting removal directly through your county’s website.
| Date | Status | Borrower | Loan Amount |
|---|---|---|---|
| Open | $31,500 |
Tax History
We collect this data history from publicly available records. To have your information removed, we recommend requesting removal directly through your county’s website.
| Year | Tax Paid | Tax Assessment Tax Assessment Total Assessment is a certain percentage of the fair market value that is determined by local assessors to be the total taxable value of land and additions on the property. | Land | Improvement |
|---|---|---|---|---|
| 2025 | $484 | $5,335 | $716 | $4,619 |
| 2024 | $452 | $5,335 | $716 | $4,619 |
| 2023 | $452 | $5,081 | $814 | $4,267 |
| 2022 | $383 | $4,496 | $899 | $3,597 |
| 2021 | $355 | $4,282 | $912 | $3,370 |
| 2020 | $447 | $5,459 | $906 | $4,553 |
| 2019 | $445 | $5,200 | $912 | $4,288 |
| 2018 | $411 | $4,961 | $870 | $4,091 |
| 2017 | $388 | $4,366 | $621 | $3,745 |
| 2016 | $351 | $4,158 | $548 | $3,610 |
| 2015 | $313 | $3,618 | $359 | $3,259 |
| 2014 | $312 | $3,618 | $359 | $3,259 |
Map
- 709 E Broadway St
- 402 E Maple St
- 850 E Moses St
- 616 E Cherry St
- 509 E Cherry St
- 719 E 2nd St
- 1002 E Walnut St
- 1001 E Pecan St
- 911 E 3rd St
- 420 N Central Ave
- 1121 E Walnut St
- 112 S Highland Ave
- 828 E 5th St
- 1119 E Cherry St
- 1121 E Cherry St
- 1123 E Cherry St
- 1125 E Cherry St
- 217 W Maple St
- 1028 E Vine St
- 302 W Maple St
Ask me questions while you tour the home.