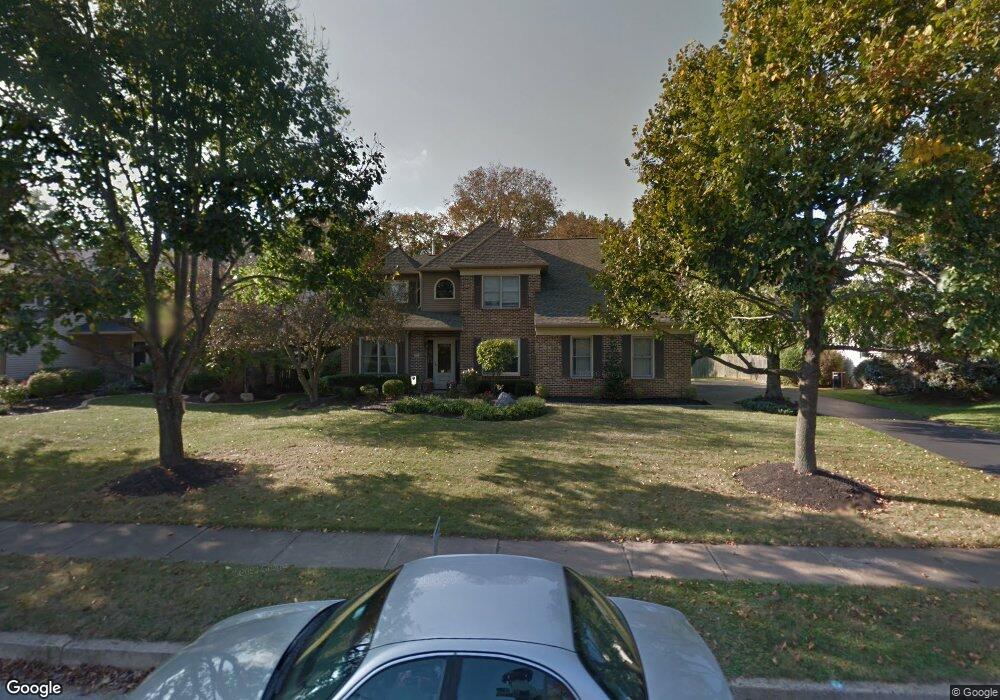
315 R Glad Way Unit R Collegeville, PA 19426
Estimated Value: $724,000 - $782,651
4
Beds
3
Baths
2,804
Sq Ft
$272/Sq Ft
Est. Value
About This Home
This home is located at 315 R Glad Way Unit R, Collegeville, PA 19426 and is currently estimated at $761,913, approximately $271 per square foot. 315 R Glad Way Unit R is a home located in Montgomery County with nearby schools including South Elementary School, Perkiomen Valley Middle School East, and Holy Cross Regional Catholic School.
Ownership History
Date
Name
Owned For
Owner Type
Purchase Details
Closed on
Jun 26, 2019
Sold by
Dubas Brian G and Dubas Jennifer E
Bought by
Barnshaw John J and Barnshaw Carrie A
Current Estimated Value
Home Financials for this Owner
Home Financials are based on the most recent Mortgage that was taken out on this home.
Original Mortgage
$363,500
Outstanding Balance
$318,981
Interest Rate
3.9%
Mortgage Type
New Conventional
Estimated Equity
$442,932
Purchase Details
Closed on
Aug 26, 2005
Sold by
Radcliffe Raymond A and Radcliffe Nancy
Bought by
Dubas Brian G and Dubas Jennifer E
Home Financials for this Owner
Home Financials are based on the most recent Mortgage that was taken out on this home.
Original Mortgage
$42,900
Interest Rate
5.79%
Mortgage Type
Credit Line Revolving
Purchase Details
Closed on
Jan 16, 1996
Sold by
Radcliffe Raymond A
Bought by
Radcliffe Raymond A and Radcliffe Nancy
Create a Home Valuation Report for This Property
The Home Valuation Report is an in-depth analysis detailing your home's value as well as a comparison with similar homes in the area
Home Values in the Area
Average Home Value in this Area
Purchase History
| Date | Buyer | Sale Price | Title Company |
|---|---|---|---|
| Barnshaw John J | $530,000 | None Available | |
| Dubas Brian G | $429,000 | -- | |
| Radcliffe Raymond A | -- | First American Title Ins Co |
Source: Public Records
Mortgage History
| Date | Status | Borrower | Loan Amount |
|---|---|---|---|
| Open | Barnshaw John J | $363,500 | |
| Previous Owner | Dubas Brian G | $42,900 | |
| Previous Owner | Dubas Brian G | $343,200 |
Source: Public Records
Tax History Compared to Growth
Tax History
| Year | Tax Paid | Tax Assessment Tax Assessment Total Assessment is a certain percentage of the fair market value that is determined by local assessors to be the total taxable value of land and additions on the property. | Land | Improvement |
|---|---|---|---|---|
| 2025 | $10,646 | $216,760 | $65,710 | $151,050 |
| 2024 | $10,646 | $216,760 | $65,710 | $151,050 |
| 2023 | $10,031 | $216,760 | $65,710 | $151,050 |
| 2022 | $9,833 | $216,760 | $65,710 | $151,050 |
| 2021 | $9,479 | $216,760 | $65,710 | $151,050 |
| 2020 | $9,206 | $216,760 | $65,710 | $151,050 |
| 2019 | $9,099 | $216,760 | $65,710 | $151,050 |
| 2018 | $1,789 | $216,760 | $65,710 | $151,050 |
| 2017 | $8,638 | $216,760 | $65,710 | $151,050 |
| 2016 | $8,554 | $216,760 | $65,710 | $151,050 |
| 2015 | $8,163 | $216,760 | $65,710 | $151,050 |
| 2014 | $8,163 | $216,760 | $65,710 | $151,050 |
Source: Public Records
Map
Nearby Homes
- 295 Freeland Dr
- 828 Locust St
- 112 Hemlock Dr
- 4 Donny Brook Way
- 101 Juniper Ct
- 109 Larchwood Ct
- 315 Chestnut St
- 142 Larchwood Ct
- 15 Henry Ave
- 944 E Main St
- 300 Speaker Place Unit 1901
- 609 Muhlenberg Dr Unit 205
- 42 Meadow Rd
- 6 Longacre Dr
- Rollins Plan at Linden Ridge
- Groton Plan at Linden Ridge
- Lorimer Plan at Linden Ridge
- Pickering Plan at Linden Ridge
- 12 Scholl Dr
- 831 Dewees Place Unit 1308
- 315 R Glad Way
- 311 R Glad Way
- 319 R Glad Way
- 323 R Glad Way
- 309 R Glad Way
- 525 Shakespeare Dr
- 316 R Glad Way
- 320 R Glad Way
- 327 R Glad Way
- 305 R Glad Way
- 324 R Glad Way
- 524 Shakespeare Dr
- 521 Shakespeare Dr
- 331 R Glad Way
- 328 R Glad Way
- 315 Sonnet Ln
- 520 Shakespeare Dr
- 330 Avon Ave
- 322 Avon Ave
- 319 Sonnet Ln