Estimated Value: $192,295 - $273,000
--
Bed
--
Bath
1,482
Sq Ft
$146/Sq Ft
Est. Value
About This Home
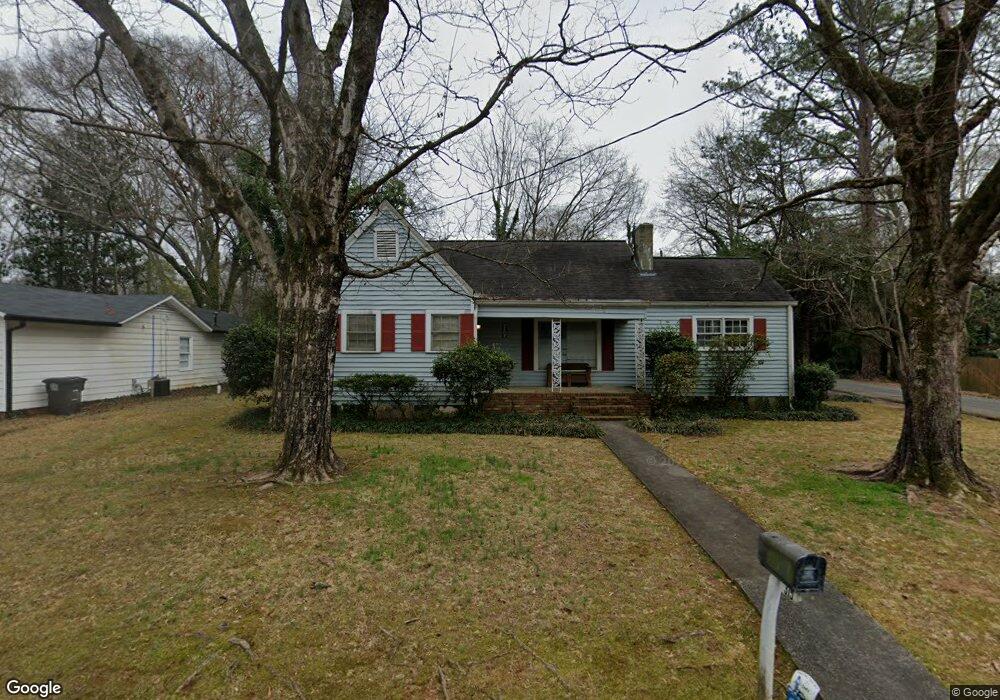
This home is located at 315 Roswell Ave SE, Rome, GA 30161 and is currently estimated at $217,074, approximately $146 per square foot. 315 Roswell Ave SE is a home located in Floyd County with nearby schools including Rome High School, St. Mary School, and Darlington School.
Ownership History
Date
Name
Owned For
Owner Type
Purchase Details
Closed on
Mar 9, 2021
Sold by
Norris Charles E
Bought by
Mcn Property Rentals Llc
Current Estimated Value
Purchase Details
Closed on
Sep 11, 2012
Sold by
Gaston Gregory Maxwell /Tr
Bought by
Norris Meredith Garrison
Purchase Details
Closed on
Dec 6, 2005
Sold by
Gaston Gregory Maxwell
Bought by
Gaston Gregory Maxwell
Purchase Details
Closed on
Dec 13, 1995
Sold by
Killingsworth Verna G
Bought by
Gaston Willard Maxwell
Purchase Details
Closed on
Aug 31, 1984
Sold by
Bacon Sherrie L
Bought by
Killingsworth Verna G
Purchase Details
Closed on
Jan 16, 1981
Sold by
Meeks Linda Kay
Bought by
Bacon Sherrie L
Purchase Details
Closed on
Sep 11, 1974
Sold by
Meeks Larry
Bought by
Meeks Linda Kay
Purchase Details
Closed on
Jan 1, 1901
Bought by
Meeks Larry
Create a Home Valuation Report for This Property
The Home Valuation Report is an in-depth analysis detailing your home's value as well as a comparison with similar homes in the area
Home Values in the Area
Average Home Value in this Area
Purchase History
| Date | Buyer | Sale Price | Title Company |
|---|---|---|---|
| Mcn Property Rentals Llc | -- | -- | |
| Norris Meredith Garrison | -- | -- | |
| Gaston Gregory Maxwell | -- | -- | |
| Gaston Willard Maxwell | -- | -- | |
| Killingsworth Verna G | $45,000 | -- | |
| Bacon Sherrie L | $38,000 | -- | |
| Meeks Linda Kay | -- | -- | |
| Meeks Larry | -- | -- |
Source: Public Records
Tax History Compared to Growth
Tax History
| Year | Tax Paid | Tax Assessment Tax Assessment Total Assessment is a certain percentage of the fair market value that is determined by local assessors to be the total taxable value of land and additions on the property. | Land | Improvement |
|---|---|---|---|---|
| 2024 | $2,359 | $61,620 | $10,368 | $51,252 |
| 2023 | $2,182 | $59,160 | $9,216 | $49,944 |
| 2022 | $1,438 | $39,406 | $7,488 | $31,918 |
| 2021 | $1,355 | $36,513 | $7,488 | $29,025 |
| 2020 | $1,254 | $33,508 | $5,760 | $27,748 |
| 2019 | $1,191 | $32,174 | $5,760 | $26,414 |
| 2018 | $1,140 | $30,810 | $5,760 | $25,050 |
| 2017 | $1,114 | $30,098 | $5,760 | $24,338 |
| 2016 | $1,108 | $29,829 | $5,760 | $24,069 |
| 2015 | $1,046 | $29,829 | $5,760 | $24,069 |
| 2014 | $1,046 | $29,829 | $5,760 | $24,069 |
Source: Public Records
Map
Nearby Homes
- 311 Roswell Ave SE
- 6 Haley Dr SE
- 29 Pear St
- 415 E 10th St SE
- 138 E 8th Ave Unit 25
- 801 Maple Ave SW
- 211 E 11th St SE
- 206 E 4th St
- 320 E 3rd Ave
- 702 River Ave SW
- 2 Coral Ave SW
- 9 Eastridge Ct SW
- 2 Fair St SW
- 407 E 3rd St
- 312 E 3rd St
- 1 Vassar Dr SE
- 202 E 4th Ave Unit 5
- 202 E 4th Ave
- 214 E 3rd St
- 31 Notasulga Dr SW
- 313 Roswell Ave SE
- 1 Grove St SE
- 0 Roswell Ave SE Unit 7470011
- 0 Roswell Ave SE Unit 8331889
- 0 Roswell Ave SE Unit 8119117
- 0 Roswell Ave SE Unit 8534683
- 0 Roswell Ave SE Unit 9055125
- 0 Roswell Ave SE Unit 3118264
- 0 Roswell Ave SE Unit 3225606
- 0 Roswell Ave SE Unit 3236090
- 0 Roswell Ave SE Unit 3282228
- 311 Roswell Ave SE Unit 8A
- 314 Roswell Ave SE
- 312 Roswell Ave SE
- 309 Roswell Ave SE
- 319 Cooper Dr SE
- 310 Roswell Ave SE
- 310 Clark Dr SE
- 321 Cooper Dr SE
- 308 Clark Dr SE