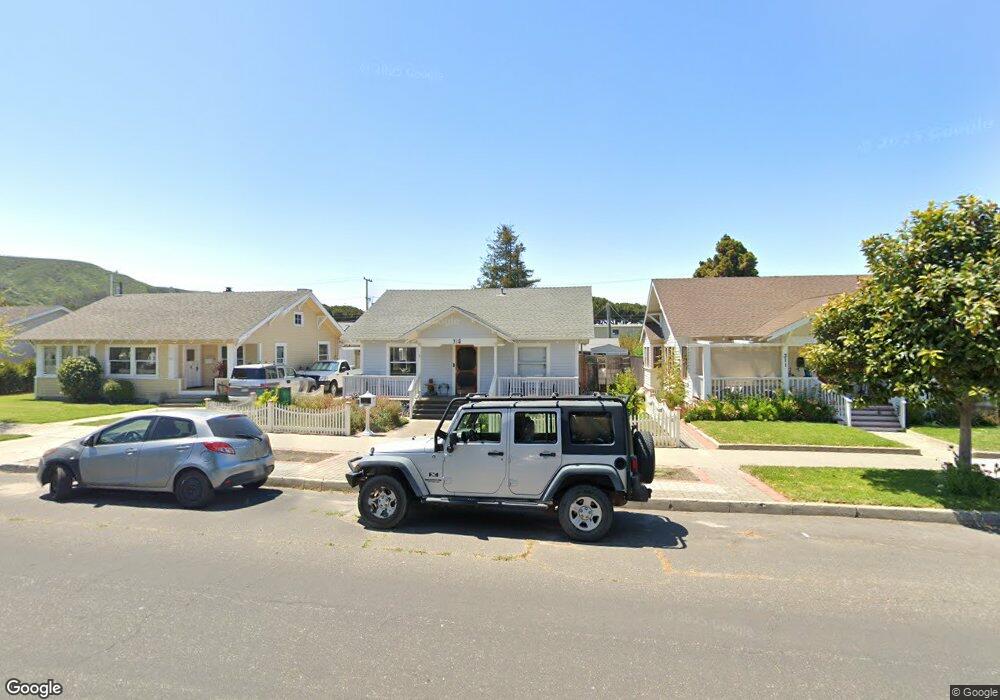
315 S G St Lompoc, CA 93436
Estimated Value: $447,000 - $2,058,000
Studio
--
Bath
--
Sq Ft
6,970
Sq Ft Lot Lot
About This Home
This home is located at 315 S G St, Lompoc, CA 93436 and is currently estimated at $906,282. 315 S G St is a home located in Santa Barbara County with nearby schools including Arthur Hapgood Elementary School, Lompoc Valley Middle School, and Lompoc High School.
Ownership History
Date
Name
Owned For
Owner Type
Purchase Details
Closed on
Jun 29, 2023
Sold by
Morlatt Administrative Trust
Bought by
Morlatt Residence Trust and Caldwell
Current Estimated Value
Purchase Details
Closed on
Jan 12, 2022
Sold by
Lynn Morlatt Retha and Lynn Ronald W
Bought by
Retha Lynn Morlatt Trust
Purchase Details
Closed on
Jan 30, 2018
Sold by
Morlatt Retha Lynn and Retha Lynn Caldwell Trust
Bought by
Morlatt Retha Lynn and Morlatt Ronald W
Purchase Details
Closed on
Dec 21, 2001
Sold by
Caldwell Retha L
Bought by
Caldwell Retha Lynn and Retha Lynn Caldwell Trust
Create a Home Valuation Report for This Property
The Home Valuation Report is an in-depth analysis detailing your home's value as well as a comparison with similar homes in the area
Home Values in the Area
Average Home Value in this Area
Purchase History
We collect this data history from publicly available records. To have your information removed, we recommend requesting removal directly through your county’s website.
| Date | Buyer | Sale Price | Title Company |
|---|---|---|---|
| Morlatt Residence Trust | -- | None Listed On Document | |
| Retha Lynn Morlatt Trust | -- | None Listed On Document | |
| Morlatt Retha Lynn | -- | None Available | |
| Caldwell Retha Lynn | -- | -- |
Source: Public Records
Tax History
| Year | Tax Paid | Tax Assessment Tax Assessment Total Assessment is a certain percentage of the fair market value that is determined by local assessors to be the total taxable value of land and additions on the property. | Land | Improvement |
|---|---|---|---|---|
| 2025 | $1,791 | $161,359 | $79,749 | $81,610 |
| 2023 | $1,791 | $155,095 | $76,653 | $78,442 |
| 2022 | $1,680 | $152,054 | $75,150 | $76,904 |
| 2021 | $1,696 | $149,074 | $73,677 | $75,397 |
| 2020 | $1,677 | $147,546 | $72,922 | $74,624 |
| 2019 | $1,647 | $144,654 | $71,493 | $73,161 |
| 2018 | $1,620 | $141,819 | $70,092 | $71,727 |
| 2017 | $1,589 | $139,039 | $68,718 | $70,321 |
| 2016 | $1,558 | $136,314 | $67,371 | $68,943 |
| 2014 | $1,522 | $131,639 | $65,061 | $66,578 |
Source: Public Records
Map
Nearby Homes
Your Personal Tour Guide
Ask me questions while you tour the home.