Estimated Value: $617,603 - $700,000
4
Beds
3
Baths
2,648
Sq Ft
$244/Sq Ft
Est. Value
About This Home
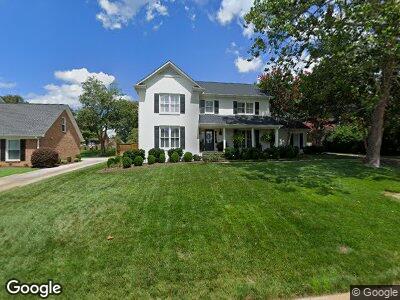
This home is located at 315 S Wingfield Rd, Greer, SC 29650 and is currently estimated at $647,151, approximately $244 per square foot. 315 S Wingfield Rd is a home located in Greenville County with nearby schools including Buena Vista Elementary School, Northwood Middle School, and Riverside High School.
Ownership History
Date
Name
Owned For
Owner Type
Purchase Details
Closed on
May 23, 2014
Sold by
Love Bradford Leland and Love Mary Elizabeth Phillips
Bought by
Burgess Michael A and Burgess Shannon D
Current Estimated Value
Purchase Details
Closed on
Jul 13, 2005
Sold by
Pettit Susan Graeber
Bought by
Leland Love Bradford
Home Financials for this Owner
Home Financials are based on the most recent Mortgage that was taken out on this home.
Original Mortgage
$239,200
Interest Rate
5%
Mortgage Type
Adjustable Rate Mortgage/ARM
Purchase Details
Closed on
Jul 11, 2005
Sold by
Pettit Susan Graeber
Bought by
Leland Love Bradford
Home Financials for this Owner
Home Financials are based on the most recent Mortgage that was taken out on this home.
Original Mortgage
$239,200
Interest Rate
5%
Mortgage Type
Adjustable Rate Mortgage/ARM
Create a Home Valuation Report for This Property
The Home Valuation Report is an in-depth analysis detailing your home's value as well as a comparison with similar homes in the area
Home Values in the Area
Average Home Value in this Area
Purchase History
| Date | Buyer | Sale Price | Title Company |
|---|---|---|---|
| Burgess Michael A | $345,000 | -- | |
| Leland Love Bradford | $299,000 | -- | |
| Leland Love Bradford | -- | -- | |
| Leland Love Bradford | -- | -- |
Source: Public Records
Mortgage History
| Date | Status | Borrower | Loan Amount |
|---|---|---|---|
| Open | Burgess Shannon D | $75,000 | |
| Open | Burgess Shannon D | $288,700 | |
| Closed | Burgess Michael A | $288,000 | |
| Previous Owner | Love Bradford Leland | $190,000 | |
| Previous Owner | Love Bradford L | $240,000 | |
| Previous Owner | Love Bradford L | $25,000 | |
| Previous Owner | Leland Love Bradford | $239,200 |
Source: Public Records
Tax History Compared to Growth
Tax History
| Year | Tax Paid | Tax Assessment Tax Assessment Total Assessment is a certain percentage of the fair market value that is determined by local assessors to be the total taxable value of land and additions on the property. | Land | Improvement |
|---|---|---|---|---|
| 2024 | $2,210 | $13,930 | $1,980 | $11,950 |
| 2023 | $2,210 | $13,930 | $1,980 | $11,950 |
| 2022 | $2,040 | $13,930 | $1,980 | $11,950 |
| 2021 | $2,041 | $13,930 | $1,980 | $11,950 |
| 2020 | $2,100 | $13,530 | $1,600 | $11,930 |
| 2019 | $2,058 | $13,530 | $1,600 | $11,930 |
| 2018 | $2,192 | $13,530 | $1,600 | $11,930 |
| 2017 | $2,171 | $13,530 | $1,600 | $11,930 |
| 2016 | $2,074 | $338,160 | $40,000 | $298,160 |
| 2015 | $2,047 | $338,160 | $40,000 | $298,160 |
| 2014 | $1,645 | $271,580 | $40,000 | $231,580 |
Source: Public Records
Map
Nearby Homes
- 223 E Shallowstone Rd
- 607 Stone Ridge Rd
- 3 Treyburn Ct
- 102 Sugar Mill Way
- 600 Stone Ridge Rd
- 112 Silver Creek Ct
- 106 Plum Mill Ct
- 20 Pristine Dr
- 207 White Water Ct
- 1 Rugosa Way
- 332 Ascot Ridge Ln
- 203 Barrington Park Dr
- 811 Phillips Rd
- 201 Sugar Creek Ln
- 105 Belfrey Dr
- 505 Sugar Mill Rd
- 108 Hancock Ln
- 111 Farm Valley Ct
- 105 Berrywood Ct
- 34 Tamaron Way
- 315 S Wingfield Rd
- 313 S Wingfield Rd
- 317 S Wingfield Rd
- 110 Stonecrest Rd
- 112 Stonecrest Rd
- 311 S Wingfield Rd
- 314 S Wingfield Rd
- 108 Stonecrest Rd
- 319 S Wingfield Rd
- 114 Stonecrest Rd
- 312 S Wingfield Rd
- 316 S Wingfield Rd
- 106 Stonecrest Rd
- 309 S Wingfield Rd
- 310 S Wingfield Rd
- 116 Stonecrest Rd
- 111 Stonecrest Rd
- 320 S Wingfield Rd
- 109 Stonecrest Rd
- 104 Stonecrest Rd