Estimated Value: $326,000 - $372,000
3
Beds
3
Baths
2,627
Sq Ft
$132/Sq Ft
Est. Value
About This Home
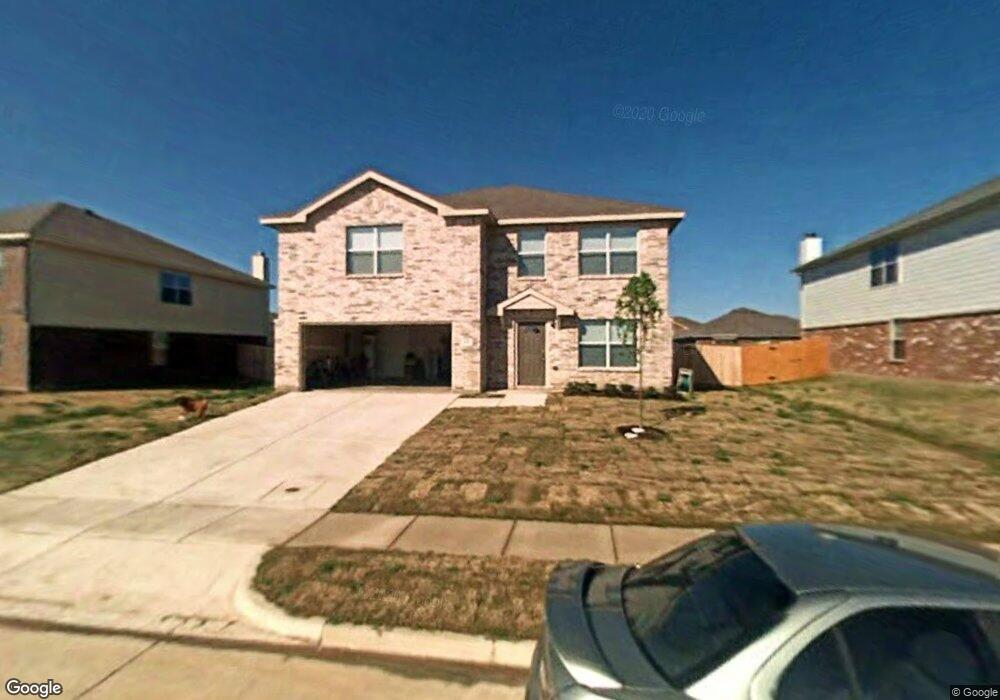
This home is located at 315 Saddlebrook Dr, Krum, TX 76249 and is currently estimated at $347,627, approximately $132 per square foot. 315 Saddlebrook Dr is a home located in Denton County with nearby schools including Krum Early Education Center, Blanche Dodd Intermediate School, and Krum Middle School.
Ownership History
Date
Name
Owned For
Owner Type
Purchase Details
Closed on
Jul 28, 2016
Sold by
Reynolds Charles and Reynolds Julie
Bought by
Alford John William
Current Estimated Value
Home Financials for this Owner
Home Financials are based on the most recent Mortgage that was taken out on this home.
Original Mortgage
$196,377
Outstanding Balance
$156,989
Interest Rate
3.54%
Mortgage Type
FHA
Estimated Equity
$190,638
Purchase Details
Closed on
Oct 2, 2007
Sold by
Hmh Lifestyles Lp
Bought by
Reynolds Charles and Reynolds Julie
Home Financials for this Owner
Home Financials are based on the most recent Mortgage that was taken out on this home.
Original Mortgage
$158,833
Interest Rate
6.47%
Mortgage Type
Purchase Money Mortgage
Purchase Details
Closed on
Jun 25, 2007
Sold by
Jabez Development Lp
Bought by
Hmh Lifestyles Lp
Home Financials for this Owner
Home Financials are based on the most recent Mortgage that was taken out on this home.
Original Mortgage
$112,000
Interest Rate
6.19%
Mortgage Type
Purchase Money Mortgage
Create a Home Valuation Report for This Property
The Home Valuation Report is an in-depth analysis detailing your home's value as well as a comparison with similar homes in the area
Home Values in the Area
Average Home Value in this Area
Purchase History
We collect this data history from publicly available records. To have your information removed, we recommend requesting removal directly through your county’s website.
| Date | Buyer | Sale Price | Title Company |
|---|---|---|---|
| Alford John William | -- | Attorney | |
| Reynolds Charles | -- | Stnt | |
| Hmh Lifestyles Lp | -- | Stnt |
Source: Public Records
Mortgage History
We collect this data history from publicly available records. To have your information removed, we recommend requesting removal directly through your county’s website.
| Date | Status | Borrower | Loan Amount |
|---|---|---|---|
| Open | Alford John William | $196,377 | |
| Previous Owner | Reynolds Charles | $158,833 | |
| Previous Owner | Hmh Lifestyles Lp | $112,000 |
Source: Public Records
Tax History
| Year | Tax Paid | Tax Assessment Tax Assessment Total Assessment is a certain percentage of the fair market value that is determined by local assessors to be the total taxable value of land and additions on the property. | Land | Improvement |
|---|---|---|---|---|
| 2025 | $5,604 | $342,668 | $74,871 | $267,797 |
| 2024 | $6,843 | $339,579 | $0 | $0 |
| 2023 | $4,992 | $372,474 | $74,871 | $297,603 |
| 2022 | $7,238 | $315,531 | $74,871 | $240,660 |
| 2021 | $5,658 | $255,131 | $47,002 | $208,129 |
| 2020 | $5,383 | $237,723 | $47,002 | $190,721 |
| 2019 | $5,701 | $236,255 | $47,002 | $189,253 |
| 2018 | $5,691 | $234,655 | $47,002 | $187,653 |
| 2017 | $5,311 | $218,035 | $47,002 | $171,033 |
| 2016 | $4,181 | $171,636 | $31,196 | $170,115 |
| 2015 | $3,258 | $156,033 | $31,196 | $149,468 |
| 2014 | $3,258 | $141,848 | $31,196 | $110,652 |
| 2013 | -- | $137,981 | $31,196 | $106,785 |
Source: Public Records
Map
Nearby Homes
- 316 Spurlock Dr
- 1405 Eagles Nest Trail
- 1510 Sequoia Dr
- 1628 Withers Way
- 1627 Kawati Way
- 205 Comanche Trail
- 1227 Eagles Nest Trail
- 105 Thoroughbred Dr
- 3207 Camden Creek Rd
- 3212 Camden Creek Rd
- Lot 3 and 4 Fm 1173
- 209 Broken Arrow
- 309 Broken Arrow
- 17972 Farm To Market Road 1173
- 3437 Lauren St
- 1443 Fox Hollow Rd
- tbdd Farm To Market Road 1173
- TBD 50 Acres Farm To Market Road 1173
- 5276 Albert Ct
- 5258 Albert Ct
- 313 Saddlebrook Dr
- 317 Saddlebrook Dr
- 311 Saddlebrook Dr
- 314 Spurlock Dr
- 400 Spurlock Dr
- 319 Saddlebrook Dr
- 316 Saddlebrook Dr
- 314 Saddlebrook Dr
- 318 Saddlebrook Dr
- 312 Spurlock Dr
- 402 Spurlock Dr
- 309 Saddlebrook Dr
- 321 Saddlebrook Dr
- 312 Saddlebrook Dr
- 320 Saddlebrook Dr
- 310 Spurlock Dr
- 404 Spurlock Dr
- 322 Saddlebrook Dr
- 307 Saddlebrook Dr
- 323 Saddlebrook Dr
Your Personal Tour Guide
Ask me questions while you tour the home.