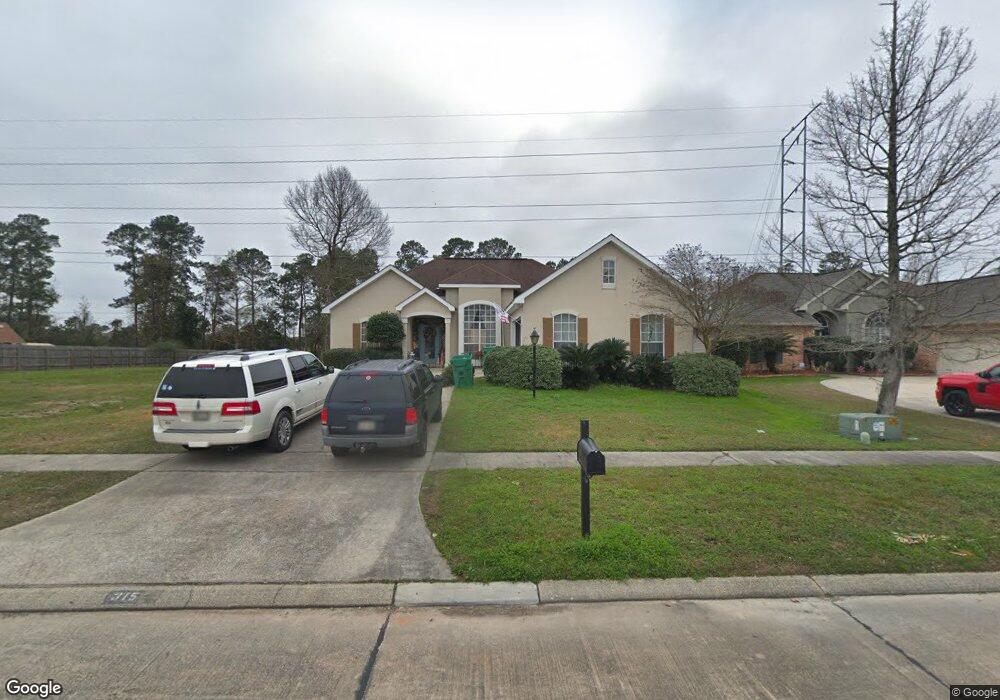
315 Spartan Loop Other Slidell, LA 70458
Estimated Value: $233,000 - $251,000
3
Beds
2
Baths
1,585
Sq Ft
$153/Sq Ft
Est. Value
About This Home
This home is located at 315 Spartan Loop Other, Slidell, LA 70458 and is currently estimated at $241,925, approximately $152 per square foot. 315 Spartan Loop Other is a home located in St. Tammany Parish with nearby schools including W.L. Abney Elementary School, St. Tammany Junior High School, and Salmen High School.
Ownership History
Date
Name
Owned For
Owner Type
Purchase Details
Closed on
Mar 3, 2023
Sold by
Boes Justin E
Bought by
Stevens Brittany Park and Stevens Brandon M
Current Estimated Value
Home Financials for this Owner
Home Financials are based on the most recent Mortgage that was taken out on this home.
Original Mortgage
$258,896
Outstanding Balance
$249,289
Interest Rate
6.13%
Mortgage Type
VA
Estimated Equity
-$7,364
Purchase Details
Closed on
Mar 30, 2011
Sold by
Faciane Alice Cartmill
Bought by
Boes Justin E and Boes Stephanie E
Home Financials for this Owner
Home Financials are based on the most recent Mortgage that was taken out on this home.
Original Mortgage
$183,870
Interest Rate
4.92%
Mortgage Type
VA
Purchase Details
Closed on
Jan 28, 2005
Sold by
Junkin Michelle G and Junkin Raymond G
Bought by
Faciane Alice Cartmill
Create a Home Valuation Report for This Property
The Home Valuation Report is an in-depth analysis detailing your home's value as well as a comparison with similar homes in the area
Home Values in the Area
Average Home Value in this Area
Purchase History
| Date | Buyer | Sale Price | Title Company |
|---|---|---|---|
| Stevens Brittany Park | $249,900 | Nola Living Title | |
| Boes Justin E | $180,000 | Advance Title Llc | |
| Faciane Alice Cartmill | $169,000 | None Available |
Source: Public Records
Mortgage History
| Date | Status | Borrower | Loan Amount |
|---|---|---|---|
| Open | Stevens Brittany Park | $258,896 | |
| Previous Owner | Boes Justin E | $183,870 |
Source: Public Records
Tax History
| Year | Tax Paid | Tax Assessment Tax Assessment Total Assessment is a certain percentage of the fair market value that is determined by local assessors to be the total taxable value of land and additions on the property. | Land | Improvement |
|---|---|---|---|---|
| 2025 | $1,915 | $19,406 | $3,000 | $16,406 |
| 2024 | $1,915 | $19,406 | $3,000 | $16,406 |
| 2023 | $2,065 | $14,808 | $3,000 | $11,808 |
| 2022 | $145,059 | $14,808 | $3,000 | $11,808 |
| 2021 | $1,450 | $14,808 | $3,000 | $11,808 |
| 2020 | $1,445 | $14,808 | $3,000 | $11,808 |
| 2019 | $2,677 | $15,355 | $3,055 | $12,300 |
| 2018 | $2,683 | $15,355 | $3,055 | $12,300 |
| 2017 | $2,701 | $15,355 | $3,055 | $12,300 |
| 2016 | $2,762 | $15,355 | $3,055 | $12,300 |
| 2015 | $1,595 | $15,355 | $3,055 | $12,300 |
| 2014 | $1,623 | $15,355 | $3,055 | $12,300 |
| 2013 | -- | $15,355 | $3,055 | $12,300 |
Source: Public Records
Map
Nearby Homes
- 315 Spartan Loop
- 304 Spartan Loop
- 322 Spartan Loop
- 301 Spartan Loop
- 109 Cypress Lakes Dr
- 114 Spartan Loop
- 101 Cypress Lakes Dr
- 197 Cypress Lakes Dr
- 330 Cypress Lakes Dr
- 317 Cypress Lakes Dr
- 289 Cypress Lakes Dr
- 161 W Augusta Ln
- 473 E Honors Point Ct
- 503 Spartan Dr Unit 2205
- 274 Cypress Lakes Dr
- 277 Cypress Lakes Dr
- 202 Megan Ln
- 3902 Croydon St
- 4046 Riviera Dr
- 317 Spartan Loop
- 313 Spartan Loop
- 313 Spartan Loop Other
- 319 Spartan Loop
- 321 Spartan Loop
- 311 Spartan Loop Other
- 311 Spartan Loop
- 309 Spartan Loop
- 308 Spartan Loop
- 310 Spartan Loop
- 308 Spartan Loop
- 306 Spartan Loop
- 306 Spartan Loop Other
- 323 Spartan Loop
- 323 Spartan Loop Other
- 312 Spartan Loop
- 307 Spartan Loop Other
- 307 Spartan Loop
- 325 Spartan Loop
- 327 Spartan Loop None
Your Personal Tour Guide
Ask me questions while you tour the home.