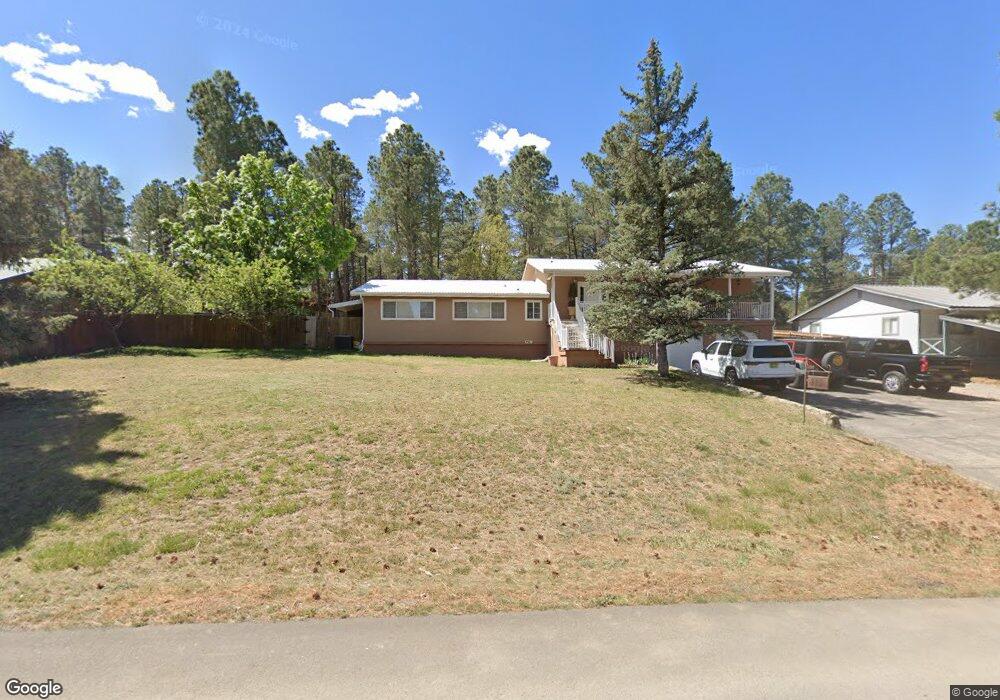
315 Spring Rd Ruidoso, NM 88345
Estimated Value: $247,000 - $489,000
4
Beds
3
Baths
2,840
Sq Ft
$134/Sq Ft
Est. Value
About This Home
This home is located at 315 Spring Rd, Ruidoso, NM 88345 and is currently estimated at $379,698, approximately $133 per square foot. 315 Spring Rd is a home located in Lincoln County with nearby schools including Sierra Vista Primary School, White Mountain Elementary School, and Ruidoso Middle School.
Ownership History
Date
Name
Owned For
Owner Type
Purchase Details
Closed on
Jun 5, 2023
Sold by
Mariposa Builders Construction Company I
Bought by
Barnett Tay Herbert and Barnett Kathy Ann
Current Estimated Value
Purchase Details
Closed on
Dec 3, 2021
Sold by
Greentree Solid Waste Authority
Bought by
Thompson Michael D and Thompson Denman Bryce
Home Financials for this Owner
Home Financials are based on the most recent Mortgage that was taken out on this home.
Original Mortgage
$255,000
Interest Rate
2.33%
Mortgage Type
Commercial
Purchase Details
Closed on
Oct 4, 2008
Sold by
Mason James S and Mason Mary J
Bought by
Thompson Michael D and Thompson Megan
Home Financials for this Owner
Home Financials are based on the most recent Mortgage that was taken out on this home.
Original Mortgage
$195,000
Interest Rate
6.52%
Mortgage Type
New Conventional
Create a Home Valuation Report for This Property
The Home Valuation Report is an in-depth analysis detailing your home's value as well as a comparison with similar homes in the area
Home Values in the Area
Average Home Value in this Area
Purchase History
| Date | Buyer | Sale Price | Title Company |
|---|---|---|---|
| Barnett Tay Herbert | -- | None Listed On Document | |
| Thompson Michael D | -- | None Available | |
| Thompson Michael D | -- | None Available |
Source: Public Records
Mortgage History
| Date | Status | Borrower | Loan Amount |
|---|---|---|---|
| Previous Owner | Thompson Michael D | $255,000 | |
| Previous Owner | Thompson Michael D | $195,000 |
Source: Public Records
Tax History Compared to Growth
Tax History
| Year | Tax Paid | Tax Assessment Tax Assessment Total Assessment is a certain percentage of the fair market value that is determined by local assessors to be the total taxable value of land and additions on the property. | Land | Improvement |
|---|---|---|---|---|
| 2025 | $2,960 | $101,389 | $15,054 | $86,335 |
| 2024 | $2,960 | $98,436 | $14,616 | $83,820 |
| 2023 | $2,960 | $95,569 | $14,190 | $81,379 |
| 2022 | $2,805 | $92,786 | $13,777 | $79,009 |
| 2021 | $2,710 | $90,075 | $13,375 | $76,700 |
| 2020 | $2,655 | $87,452 | $12,985 | $74,467 |
| 2019 | $2,484 | $85,737 | $12,730 | $73,007 |
| 2018 | $2,398 | $83,239 | $12,359 | $70,880 |
| 2017 | $2,308 | $80,814 | $11,999 | $68,815 |
| 2015 | $2,313 | $80,822 | $12,000 | $68,822 |
| 2014 | $2,313 | $80,822 | $12,000 | $68,822 |
Source: Public Records
Map
Nearby Homes
- 100 Reservoir Rd
- 732 Center St
- 105 Ridgecrest Dr
- 609 Wingfield St Unit 7
- 609 Wingfield St
- 105 Clover Dr
- 103 Nabors Ln
- 306 Arapahoe Trail
- 114 E Santa Rosa Dr
- 411 & 413 Wingfield St
- 89 W Texas St
- 2606 Sudderth Dr
- 750 Center St
- 110 Rockmount Dr
- 105 Keyes Dr Unit A2
- 110 Sherwood Loop
- 97 Rio St
- 107 Palo Alto Dr
- 121 Rio St
- 157 Fern Trail
- 319 Spring Rd
- 313 Spring Rd
- 311 Spring Rd
- 308 Spring Rd
- 308 Spring Rd
- 310 Spring Rd
- 214 Reservoir Rd
- 306 Spring Rd
- 306 Spring Rd Unit 1
- 306 Spring Rd
- 309 Grindstone Canyon Rd
- 105 Arapahoe Trail
- 309 Spring Rd
- 103 Reservoir Rd
- 321 Spring Rd
- 307 Grindstone Canyon Rd
- 307 Grindstone Canyon Rd
- 307 Grindstone Canyon Rd
- 307 Grindstone Canyon Rd
- 107 Arapahoe Trail