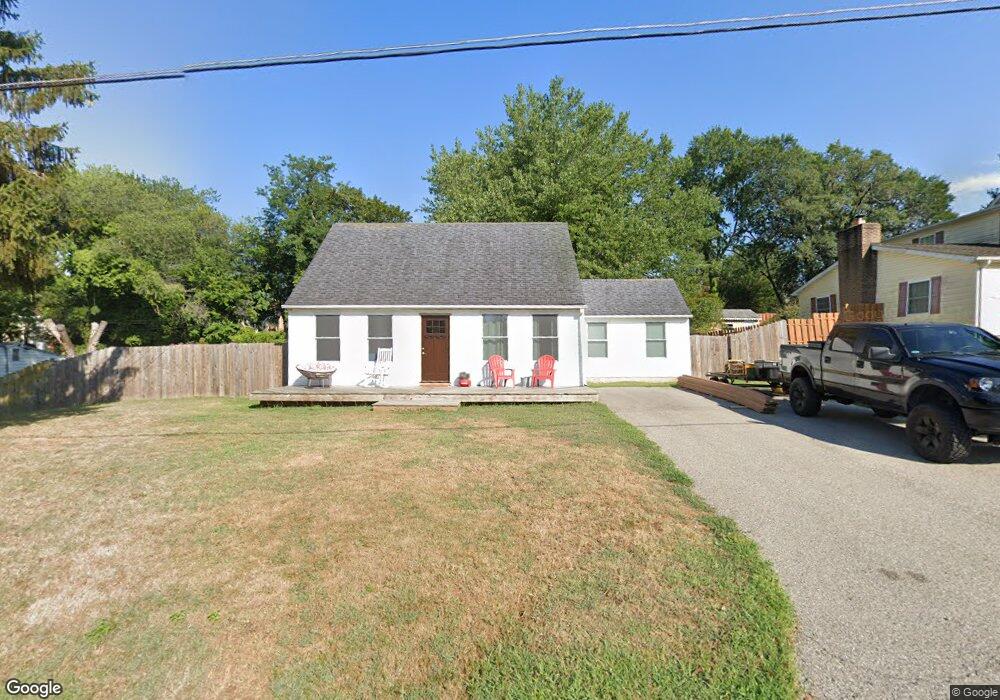
315 Stevens Ave Arnold, MD 21012
Estimated Value: $499,537 - $518,000
3
Beds
2
Baths
1,699
Sq Ft
$301/Sq Ft
Est. Value
About This Home
This home is located at 315 Stevens Ave, Arnold, MD 21012 and is currently estimated at $510,634, approximately $300 per square foot. 315 Stevens Ave is a home located in Anne Arundel County with nearby schools including Belvedere Elementary School, Severn River Middle School, and Broadneck High School.
Ownership History
Date
Name
Owned For
Owner Type
Purchase Details
Closed on
May 24, 2011
Sold by
Jones Olive M
Bought by
Kerr Stuart B
Current Estimated Value
Home Financials for this Owner
Home Financials are based on the most recent Mortgage that was taken out on this home.
Original Mortgage
$5,000
Outstanding Balance
$3,484
Interest Rate
4.94%
Mortgage Type
Purchase Money Mortgage
Estimated Equity
$507,150
Purchase Details
Closed on
May 12, 2011
Sold by
Oller Sherry S and Jones Olive M
Bought by
Kerr Stuart B
Home Financials for this Owner
Home Financials are based on the most recent Mortgage that was taken out on this home.
Original Mortgage
$5,000
Outstanding Balance
$3,484
Interest Rate
4.94%
Mortgage Type
Purchase Money Mortgage
Estimated Equity
$507,150
Purchase Details
Closed on
Jun 12, 2006
Sold by
Jones Howard P
Bought by
Jones Olive M
Purchase Details
Closed on
Jun 7, 2006
Sold by
Jones Howard P
Bought by
Jones Olive M
Create a Home Valuation Report for This Property
The Home Valuation Report is an in-depth analysis detailing your home's value as well as a comparison with similar homes in the area
Home Values in the Area
Average Home Value in this Area
Purchase History
| Date | Buyer | Sale Price | Title Company |
|---|---|---|---|
| Kerr Stuart B | $265,000 | -- | |
| Kerr Stuart B | $265,000 | Title Resources Guaranty Co | |
| Kerr Stuart B | $265,000 | -- | |
| Jones Olive M | -- | -- | |
| Jones Olive M | -- | -- |
Source: Public Records
Mortgage History
| Date | Status | Borrower | Loan Amount |
|---|---|---|---|
| Open | Kerr Stuart B | $5,000 | |
| Closed | Kerr Stuart B | $5,000 | |
| Open | Kerr Stuart B | $258,282 | |
| Closed | Kerr Stuart B | $258,282 |
Source: Public Records
Tax History
| Year | Tax Paid | Tax Assessment Tax Assessment Total Assessment is a certain percentage of the fair market value that is determined by local assessors to be the total taxable value of land and additions on the property. | Land | Improvement |
|---|---|---|---|---|
| 2025 | $3,788 | $370,667 | -- | -- |
| 2024 | $3,788 | $361,000 | $237,300 | $123,700 |
| 2023 | $3,676 | $344,233 | $0 | $0 |
| 2022 | $3,426 | $327,467 | $0 | $0 |
| 2020 | $3,255 | $301,933 | $0 | $0 |
| 2019 | $3,198 | $293,167 | $0 | $0 |
| 2018 | $2,884 | $284,400 | $166,700 | $117,700 |
| 2017 | $3,002 | $271,367 | $0 | $0 |
| 2016 | -- | $258,333 | $0 | $0 |
| 2015 | -- | $245,300 | $0 | $0 |
| 2014 | -- | $245,300 | $0 | $0 |
Source: Public Records
Map
Nearby Homes
- 303 Ternwing Dr
- 276 Overleaf Dr
- 1078 Brightleaf Ct
- 404 Alameda Pkwy
- 785 Macsherry Dr
- 401 Stewart Ave
- 539 Greenblades Ct
- 1159 Greenhill Rd
- 559 Melissa Ct
- 394 Kings College Dr
- 813 Mago Vista Rd
- 243 and 245 Haverton Rd
- 797 David Dr
- 889 Lynch Dr
- 1241 Tamarack Trail
- 201 Mill Ct
- 93 Jones Station Rd
- 127 Cresston Rd
- 1232 Taylor Ave
- 136 Collington Ct
- 313 Stevens Ave
- 317 Stevens Ave
- 314 Buena Vista Ave
- 312 Buena Vista Ave
- 312 Stevens Ave
- 311 Stevens Ave
- 316 Buena Vista Ave
- 314 Stevens Ave
- 319 Stevens Ave
- 310 Buena Vista Ave
- 310 Stevens Ave
- 318 Buena Vista Ave
- 316 Stevens Ave
- 321 Stevens Ave
- 315 Alameda Pkwy
- 313 Alameda Pkwy
- 315 Buena Vista Ave
- 311 Alameda Pkwy
- 317 Buena Vista Ave
- 317 Alameda Pkwy
Your Personal Tour Guide
Ask me questions while you tour the home.