
Seller's Agent in 2013
Mike Foulds
Foulds Real Estate Enterprises
(602) 316-9220
22 Total Sales
Estimated Value: $378,000 - $424,000
Please note, our homes are available on a first-come, first-serve basis and are not reserved until the lease is signed by all applicants and security deposits are collected.
This home features Progress Smart Home - Progress Residential's smart home app, which allows you to control the home securely from any of your devices. Learn more at
Want to tour on your own? Click the “Self Tour” button on this home’s listing or call to register for a self-guided showing at a time that works best for you.
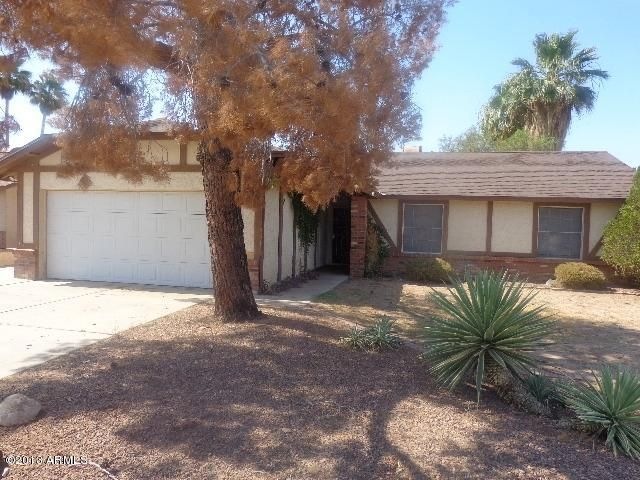
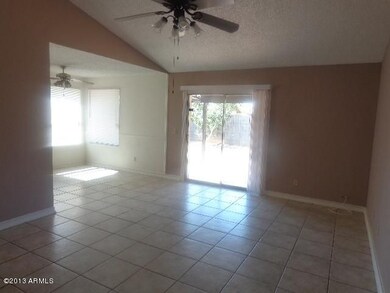
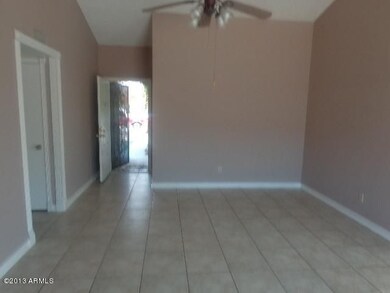
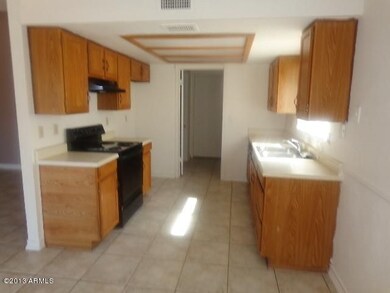
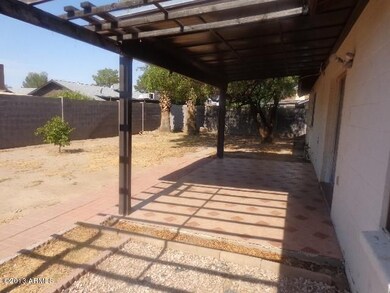
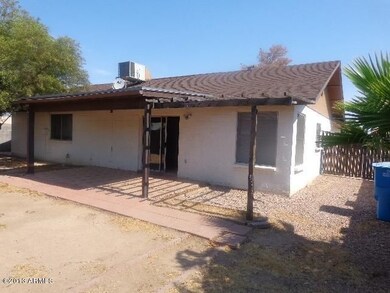
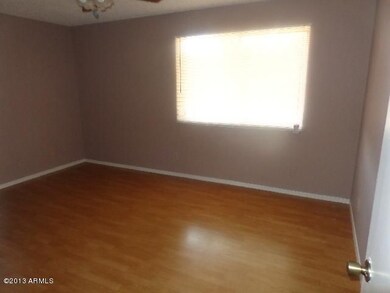
Interested in this home? You clearly have exceptional taste. This charming 3-bedroom, 2.0-bathroom home is not only pet-friendly, but also equipped with smart home features to make everyday life more convenient and connected. Homes like this don’t stay on the market for long—don’t miss your chance to make it yours. Apply today!
Some images have been virtually staged to help showcase the potential of spaces in the home. The furnishings shown are for illustrative purposes only and are not included in the home.
Last Agent to Rent the Property
Christie Oldham
Entrust Realty License #BR635618000 Listed on: 07/30/2013
Last Renter's Agent
Christie Oldham
Entrust Realty License #BR635618000 Listed on: 07/30/2013
We collect this data history from publicly available records. To have your information removed, we recommend requesting removal directly through your county’s website.
We collect this data history from publicly available records. To have your information removed, we recommend requesting removal directly through your county’s website.
| Date | Buyer | Sale Price | Title Company |
|---|---|---|---|
| -- | Os National Llc | ||
| -- | Fidelity National Title Agen | ||
| -- | Driggs Title Agency Inc | ||
| $130,000 | Driggs Title Agency Inc | ||
| $230,000 | Capital Title Agency Inc | ||
| -- | Security Title Agency | ||
| $120,000 | Security Title Agency | ||
| $84,000 | Stewart Title & Trust |
We collect this data history from publicly available records. To have your information removed, we recommend requesting removal directly through your county’s website.
| Date | Status | Borrower | Loan Amount |
|---|---|---|---|
| Previous Owner | $184,000 | ||
| Previous Owner | $118,937 | ||
| Previous Owner | $82,008 |
We collect this data history from publicly available records. To have your information removed, we recommend requesting removal directly through your county’s website.
| Date | Event | Price | List to Sale | Price per Sq Ft | Prior Sale |
|---|---|---|---|---|---|
| 01/03/2026 01/03/26 | Off Market | $1,825 | -- | -- | |
| 11/21/2025 11/21/25 | Price Changed | $1,825 | -1.9% | $1 / Sq Ft | |
| 11/19/2025 11/19/25 | Price Changed | $1,860 | -0.3% | $1 / Sq Ft | |
| 11/18/2025 11/18/25 | Price Changed | $1,865 | +0.3% | $1 / Sq Ft | |
| 11/15/2025 11/15/25 | Price Changed | $1,860 | -2.4% | $1 / Sq Ft | |
| 11/10/2025 11/10/25 | Price Changed | $1,905 | -2.1% | $1 / Sq Ft | |
| 11/09/2025 11/09/25 | Price Changed | $1,945 | -0.3% | $1 / Sq Ft | |
| 11/05/2025 11/05/25 | Price Changed | $1,950 | -2.0% | $1 / Sq Ft | |
| 11/04/2025 11/04/25 | Price Changed | $1,990 | -0.3% | $1 / Sq Ft | |
| 11/01/2025 11/01/25 | Price Changed | $1,995 | -0.3% | $1 / Sq Ft | |
| 10/31/2025 10/31/25 | Price Changed | $2,000 | 0.0% | $1 / Sq Ft | |
| 10/31/2025 10/31/25 | For Rent | $2,000 | +9.6% | -- | |
| 12/11/2024 12/11/24 | Off Market | $1,825 | -- | -- | |
| 11/27/2024 11/27/24 | Price Changed | $1,825 | +0.3% | $1 / Sq Ft | |
| 11/25/2024 11/25/24 | Price Changed | $1,820 | -0.3% | $1 / Sq Ft | |
| 11/19/2024 11/19/24 | Price Changed | $1,825 | +0.6% | $1 / Sq Ft | |
| 11/17/2024 11/17/24 | Price Changed | $1,815 | -0.5% | $1 / Sq Ft | |
| 11/05/2024 11/05/24 | Price Changed | $1,825 | -3.9% | $1 / Sq Ft | |
| 11/01/2024 11/01/24 | Price Changed | $1,900 | -1.0% | $1 / Sq Ft | |
| 10/29/2024 10/29/24 | Price Changed | $1,920 | -1.3% | $1 / Sq Ft | |
| 10/28/2024 10/28/24 | Price Changed | $1,945 | -2.8% | $1 / Sq Ft | |
| 10/25/2024 10/25/24 | Price Changed | $2,000 | -1.0% | $1 / Sq Ft | |
| 10/22/2024 10/22/24 | Price Changed | $2,020 | -4.0% | $2 / Sq Ft | |
| 10/19/2024 10/19/24 | Price Changed | $2,105 | -0.2% | $2 / Sq Ft | |
| 10/15/2024 10/15/24 | Price Changed | $2,110 | -1.4% | $2 / Sq Ft | |
| 10/13/2024 10/13/24 | Price Changed | $2,140 | -0.9% | $2 / Sq Ft | |
| 10/11/2024 10/11/24 | Price Changed | $2,160 | +0.2% | $2 / Sq Ft | |
| 10/10/2024 10/10/24 | Price Changed | $2,155 | +0.2% | $2 / Sq Ft | |
| 10/09/2024 10/09/24 | Price Changed | $2,150 | -0.9% | $2 / Sq Ft | |
| 10/08/2024 10/08/24 | Price Changed | $2,170 | -0.2% | $2 / Sq Ft | |
| 10/05/2024 10/05/24 | For Rent | $2,175 | -3.3% | -- | |
| 10/02/2024 10/02/24 | Price Changed | $2,250 | +2.3% | $2 / Sq Ft | |
| 09/29/2024 09/29/24 | Price Changed | $2,200 | +0.2% | $2 / Sq Ft | |
| 09/24/2024 09/24/24 | Price Changed | $2,195 | -0.2% | $2 / Sq Ft | |
| 09/23/2024 09/23/24 | Price Changed | $2,200 | +0.2% | $2 / Sq Ft | |
| 09/21/2024 09/21/24 | Price Changed | $2,195 | -0.2% | $2 / Sq Ft | |
| 09/19/2024 09/19/24 | Price Changed | $2,200 | +0.2% | $2 / Sq Ft | |
| 09/17/2024 09/17/24 | Price Changed | $2,195 | +119.7% | $2 / Sq Ft | |
| 08/30/2013 08/30/13 | Rented | $999 | 0.0% | -- | |
| 08/09/2013 08/09/13 | Under Contract | -- | -- | -- | |
| 07/30/2013 07/30/13 | For Rent | $999 | 0.0% | -- | |
| 05/14/2013 05/14/13 | Sold | $130,000 | 0.0% | $97 / Sq Ft | View Prior Sale |
| 02/24/2013 02/24/13 | Pending | -- | -- | -- | |
| 02/19/2013 02/19/13 | For Sale | $130,000 | -- | $97 / Sq Ft |
We collect this data history from publicly available records. To have your information removed, we recommend requesting removal directly through your county’s website.
| Year | Tax Paid | Tax Assessment Tax Assessment Total Assessment is a certain percentage of the fair market value that is determined by local assessors to be the total taxable value of land and additions on the property. | Land | Improvement |
|---|---|---|---|---|
| 2025 | $1,380 | $13,452 | -- | -- |
| 2024 | $1,340 | $12,811 | -- | -- |
| 2023 | $1,340 | $26,310 | $5,260 | $21,050 |
| 2022 | $1,295 | $20,160 | $4,030 | $16,130 |
| 2021 | $1,330 | $18,270 | $3,650 | $14,620 |
| 2020 | $1,307 | $17,370 | $3,470 | $13,900 |
| 2019 | $1,269 | $15,900 | $3,180 | $12,720 |
| 2018 | $1,229 | $14,660 | $2,930 | $11,730 |
| 2017 | $1,189 | $13,200 | $2,640 | $10,560 |
| 2016 | $1,128 | $12,200 | $2,440 | $9,760 |
| 2015 | $1,011 | $10,770 | $2,150 | $8,620 |
Seller's Agent in 2013
Mike Foulds
Foulds Real Estate Enterprises
(602) 316-9220
22 Total Sales
C
Landlord's Agent in 2013
Christie Oldham
Entrust Realty
B
Buyer's Agent in 2013
Brian Bair
OfferPad Brokerage, LLC
Source: Arizona Regional Multiple Listing Service (ARMLS)
MLS Number: 4975369
APN: 209-10-538
Disclaimer: Certain information contained herein is derived from information provided by parties other than Homes.com. All information provided is deemed reliable, but is not guaranteed to be accurate and should be independently verified.
![]() All information should be verified by the recipient and none is guaranteed as accurate by ARMLS
All information should be verified by the recipient and none is guaranteed as accurate by ARMLS
Listing Information presented by local MLS brokerage: Ten-X, local REALTOR®- Arlene Richardson - (888)-952-6393
Ask me questions while you tour the home.