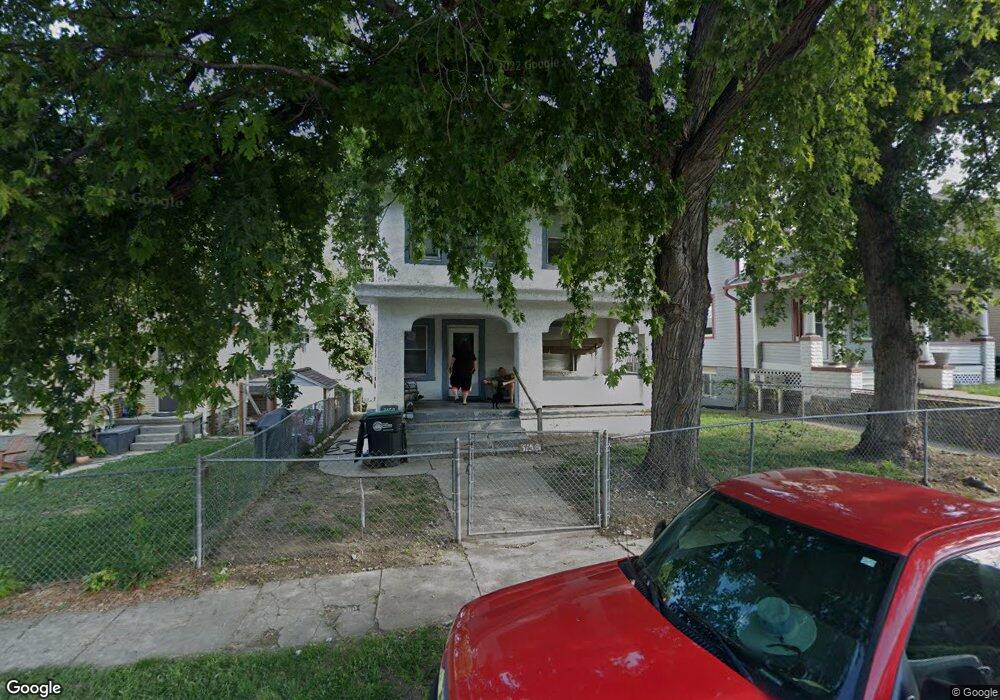
3150 Chicago St Omaha, NE 68131
Midtown Omaha NeighborhoodEstimated Value: $134,000 - $488,000
3
Beds
2
Baths
1,610
Sq Ft
$147/Sq Ft
Est. Value
About This Home
This home is located at 3150 Chicago St, Omaha, NE 68131 and is currently estimated at $236,749, approximately $147 per square foot. 3150 Chicago St is a home located in Douglas County with nearby schools including Gifford Park Elementary School, Lewis & Clark Middle School, and Central High School.
Ownership History
Date
Name
Owned For
Owner Type
Purchase Details
Closed on
Nov 11, 2020
Sold by
Sciford Kenneth B and Estate Of Dean M Sciford
Bought by
Gustafson Andrew B and Gustafson Celeste Harvey
Current Estimated Value
Home Financials for this Owner
Home Financials are based on the most recent Mortgage that was taken out on this home.
Original Mortgage
$60,000
Outstanding Balance
$53,270
Interest Rate
2.8%
Mortgage Type
Future Advance Clause Open End Mortgage
Estimated Equity
$183,479
Purchase Details
Closed on
Jan 26, 2011
Sold by
Dipalumbo Michael Scotto and Di Palumbo Jennifer Scotto
Bought by
Gustafson Andrew
Home Financials for this Owner
Home Financials are based on the most recent Mortgage that was taken out on this home.
Original Mortgage
$40,000
Interest Rate
4.79%
Mortgage Type
Future Advance Clause Open End Mortgage
Create a Home Valuation Report for This Property
The Home Valuation Report is an in-depth analysis detailing your home's value as well as a comparison with similar homes in the area
Home Values in the Area
Average Home Value in this Area
Purchase History
| Date | Buyer | Sale Price | Title Company |
|---|---|---|---|
| Gustafson Andrew B | $90,000 | Green Title & Escrow | |
| Gustafson Andrew | $44,000 | None Available | |
| Dipalumbo Michael Scotto | -- | None Available |
Source: Public Records
Mortgage History
| Date | Status | Borrower | Loan Amount |
|---|---|---|---|
| Open | Gustafson Andrew B | $60,000 | |
| Previous Owner | Gustafson Andrew | $40,000 |
Source: Public Records
Tax History Compared to Growth
Tax History
| Year | Tax Paid | Tax Assessment Tax Assessment Total Assessment is a certain percentage of the fair market value that is determined by local assessors to be the total taxable value of land and additions on the property. | Land | Improvement |
|---|---|---|---|---|
| 2025 | $2,072 | $126,300 | $19,900 | $106,400 |
| 2024 | $2,456 | $126,300 | $19,900 | $106,400 |
| 2023 | $2,456 | $116,400 | $19,900 | $96,500 |
| 2022 | $2,485 | $116,400 | $19,900 | $96,500 |
| 2021 | $1,966 | $92,900 | $19,900 | $73,000 |
| 2020 | $1,989 | $92,900 | $19,900 | $73,000 |
| 2019 | $1,857 | $86,500 | $2,400 | $84,100 |
| 2018 | $1,628 | $75,700 | $2,400 | $73,300 |
| 2017 | $1,636 | $75,700 | $2,400 | $73,300 |
| 2016 | $1,624 | $75,700 | $2,400 | $73,300 |
| 2015 | $1,603 | $75,700 | $2,400 | $73,300 |
| 2014 | $1,603 | $75,700 | $2,400 | $73,300 |
Source: Public Records
Map
Nearby Homes
- 3304 Davenport St
- 502 N 32nd St Unit 1 and 2
- 3129 California St
- 3315 Webster St
- 3323 Webster St
- 128 N 31st St Unit 21
- 105 N 31 Ave Unit 306
- 105 N 31 Ave Unit 607
- 105 N 31st Ave Unit 905
- 105 N 31st Ave Unit 502
- 3201 S Dodge Ct Unit 5810
- 3201 S Dodge Ct Unit 5506
- 3201 S Dodge Ct Unit 5510
- 132 N 35th Ave
- 200 S 31st Ave Unit 4615
- 200 S 31st Ave Unit 4602
- 200 S 31st Ave Unit 4209
- 200 S 31st Ave Unit 4814
- 121 N 36th St
- 3200 Farnam Ct Unit 3610