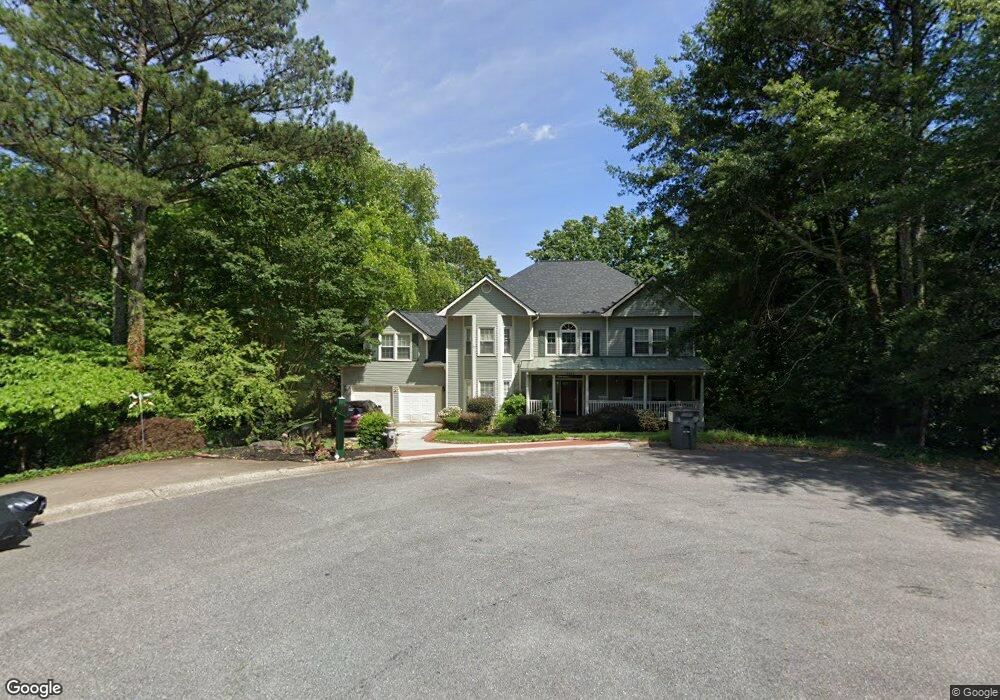
3150 Maley Ct Marietta, GA 30066
Sandy Plains NeighborhoodEstimated Value: $668,677 - $740,000
4
Beds
4
Baths
3,750
Sq Ft
$187/Sq Ft
Est. Value
About This Home
This home is located at 3150 Maley Ct, Marietta, GA 30066 and is currently estimated at $702,669, approximately $187 per square foot. 3150 Maley Ct is a home located in Cobb County with nearby schools including Rocky Mount Elementary School, Simpson Middle School, and Lassiter High School.
Ownership History
Date
Name
Owned For
Owner Type
Purchase Details
Closed on
Sep 17, 2025
Sold by
Rodene Prenide and Rodene Fritz D
Bought by
F And P Rodene Trust and Rodene
Current Estimated Value
Purchase Details
Closed on
Aug 27, 2008
Sold by
Clark Matthew D and Clark Molly C
Bought by
Rodene Prenide and Rodene Fritz D
Home Financials for this Owner
Home Financials are based on the most recent Mortgage that was taken out on this home.
Original Mortgage
$272,000
Interest Rate
6.13%
Mortgage Type
New Conventional
Purchase Details
Closed on
Apr 21, 1994
Sold by
Grinstead Robert L Barbara C
Bought by
Shields William M Mary
Home Financials for this Owner
Home Financials are based on the most recent Mortgage that was taken out on this home.
Original Mortgage
$160,950
Interest Rate
6.95%
Mortgage Type
Assumption
Create a Home Valuation Report for This Property
The Home Valuation Report is an in-depth analysis detailing your home's value as well as a comparison with similar homes in the area
Home Values in the Area
Average Home Value in this Area
Purchase History
| Date | Buyer | Sale Price | Title Company |
|---|---|---|---|
| F And P Rodene Trust | -- | None Listed On Document | |
| Rodene Prenide | $340,000 | -- | |
| Shields William M Mary | $26,900 | -- |
Source: Public Records
Mortgage History
| Date | Status | Borrower | Loan Amount |
|---|---|---|---|
| Previous Owner | Rodene Prenide | $272,000 | |
| Previous Owner | Shields William M Mary | $160,950 | |
| Closed | Shields William M Mary | $2,894 |
Source: Public Records
Tax History Compared to Growth
Tax History
| Year | Tax Paid | Tax Assessment Tax Assessment Total Assessment is a certain percentage of the fair market value that is determined by local assessors to be the total taxable value of land and additions on the property. | Land | Improvement |
|---|---|---|---|---|
| 2025 | $8,037 | $287,396 | $52,000 | $235,396 |
| 2024 | $7,416 | $245,976 | $46,000 | $199,976 |
| 2023 | $5,644 | $187,208 | $40,000 | $147,208 |
| 2022 | $5,682 | $187,208 | $40,000 | $147,208 |
| 2021 | $5,682 | $187,208 | $40,000 | $147,208 |
| 2020 | $5,247 | $172,872 | $32,800 | $140,072 |
| 2019 | $5,247 | $172,872 | $32,800 | $140,072 |
| 2018 | $4,798 | $158,088 | $32,800 | $125,288 |
| 2017 | $4,545 | $158,088 | $32,800 | $125,288 |
| 2016 | $3,479 | $121,016 | $26,000 | $95,016 |
| 2015 | $3,565 | $121,016 | $26,000 | $95,016 |
| 2014 | $3,595 | $121,016 | $0 | $0 |
Source: Public Records
Map
Nearby Homes
- 3130 Maley Ct
- 3147 Swallow Dr NE
- 3238 Mountain Hollow Dr
- 3350 Brookhill Cir
- 3798 Upland Dr
- 3851 Timber Hollow Way
- 3333 Devaughn Dr NE
- 4259 Arbor Club Dr
- 2696 S Arbor Dr
- 4397 Windsor Oaks Cir
- 3480 Pebble Hill Dr
- 3901 Hazelhurst Dr
- 4302 Highborne Dr NE Unit 3
- 2713 Arbor Summit
- 3043 Sawyer Trace NE
- 4219 N Mountain Rd NE
- 3623 Summerford Way
- 3141 Maley Ct
- 3035 Lilian Ct
- 3037 Lilian Ct
- 3961 Regas Dr
- 3282 Pete Shaw Rd
- 3131 Maley Ct
- 3991 Regas Dr
- 3945 Regas Dr
- 0 Lillian Ct Unit 8639166
- 0 Lillian Ct Unit 8569096
- 0 Lillian Ct
- 0 Regas Dr Unit 3165042
- 3292 Pete Shaw Rd
- 4005 Regas Dr
- 3041 Vinson Dr Unit 2
- 3931 Regas Dr
- 3940 Regas Dr
- 3281 Pete Shaw Rd
- 3021 Vinson Dr Unit 2
- 3980 Regas Dr