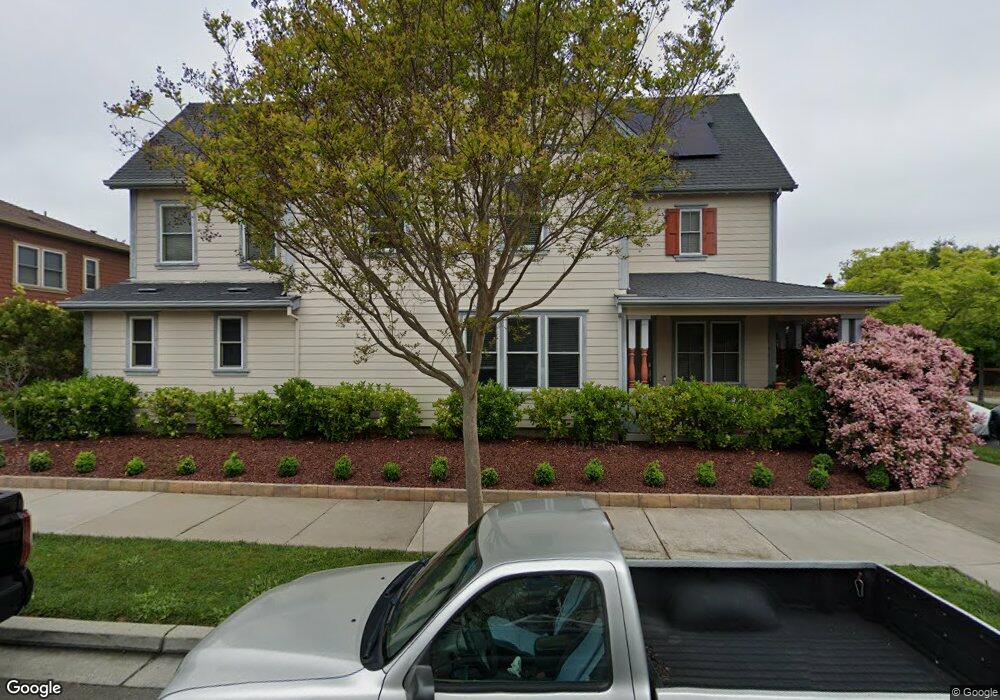
3150 N Front St Hercules, CA 94547
Central NeighborhoodEstimated Value: $804,000 - $885,241
4
Beds
3
Baths
2,193
Sq Ft
$390/Sq Ft
Est. Value
About This Home
This home is located at 3150 N Front St, Hercules, CA 94547 and is currently estimated at $855,310, approximately $390 per square foot. 3150 N Front St is a home located in Contra Costa County with nearby schools including Ohlone Elementary School, Hercules Middle School, and Hercules High School.
Ownership History
Date
Name
Owned For
Owner Type
Purchase Details
Closed on
Mar 17, 2006
Sold by
William Lyon Homes Inc
Bought by
Chin Steven and Gardiola-Chin Gina
Current Estimated Value
Home Financials for this Owner
Home Financials are based on the most recent Mortgage that was taken out on this home.
Original Mortgage
$567,800
Outstanding Balance
$328,241
Interest Rate
6.56%
Mortgage Type
Fannie Mae Freddie Mac
Estimated Equity
$527,069
Create a Home Valuation Report for This Property
The Home Valuation Report is an in-depth analysis detailing your home's value as well as a comparison with similar homes in the area
Home Values in the Area
Average Home Value in this Area
Purchase History
| Date | Buyer | Sale Price | Title Company |
|---|---|---|---|
| Chin Steven | $710,000 | First American Title Co |
Source: Public Records
Mortgage History
| Date | Status | Borrower | Loan Amount |
|---|---|---|---|
| Open | Chin Steven | $567,800 |
Source: Public Records
Tax History Compared to Growth
Tax History
| Year | Tax Paid | Tax Assessment Tax Assessment Total Assessment is a certain percentage of the fair market value that is determined by local assessors to be the total taxable value of land and additions on the property. | Land | Improvement |
|---|---|---|---|---|
| 2025 | $14,078 | $916,000 | $465,000 | $451,000 |
| 2024 | $13,302 | $915,000 | $464,140 | $450,860 |
| 2023 | $13,302 | $855,500 | $433,958 | $421,542 |
| 2022 | $13,376 | $855,500 | $433,958 | $421,542 |
| 2021 | $11,496 | $696,500 | $353,304 | $343,196 |
| 2019 | $10,953 | $663,000 | $336,311 | $326,689 |
| 2018 | $10,203 | $615,000 | $311,963 | $303,037 |
| 2017 | $10,120 | $608,500 | $308,666 | $299,834 |
| 2016 | $9,871 | $591,000 | $299,789 | $291,211 |
| 2015 | $8,881 | $505,500 | $256,418 | $249,082 |
| 2014 | $7,618 | $403,000 | $204,424 | $198,576 |
Source: Public Records
Map
Nearby Homes
- 2036 Serra Ln
- 2054 Clark St
- 1142 Taraya Terrace
- 1136 Taraya Terrace
- 406 Olympus Unit 5
- 332 N Wildwood
- 1405 Forest Run
- 1407 Forest Run
- 705 Hermes Unit 5
- 303 Atlas Dr Unit 7
- 309 Devonwood Unit 309
- 1018 Promenade St
- 398 N Wildwood
- 44 Glenwood Unit 44
- 11 Bonny Doone
- 15 Glenwood
- 119 Glenwood
- 31 Sapphire Ct
- 287 Scotts Valley
- 184 Pearce
- 3144 N Front St
- 2141 Drake Ln
- 3162 N Front St
- 3156 N Front St
- 2135 Drake Ln Unit 1
- 2138 Drake Ln
- 3138 N Front St
- 2132 Drake Ln
- 2129 Drake Ln
- 3132 N Front St
- 2126 Drake Ln
- 2123 Drake Ln
- 2225 Tsushima St
- 2219 Tsushima St
- 2213 Tsushima St
- 2120 Drake Ln
- 2207 Tsushima St
- 3126 N Front St
- 2117 Drake Ln
- 2195 Tsushima St