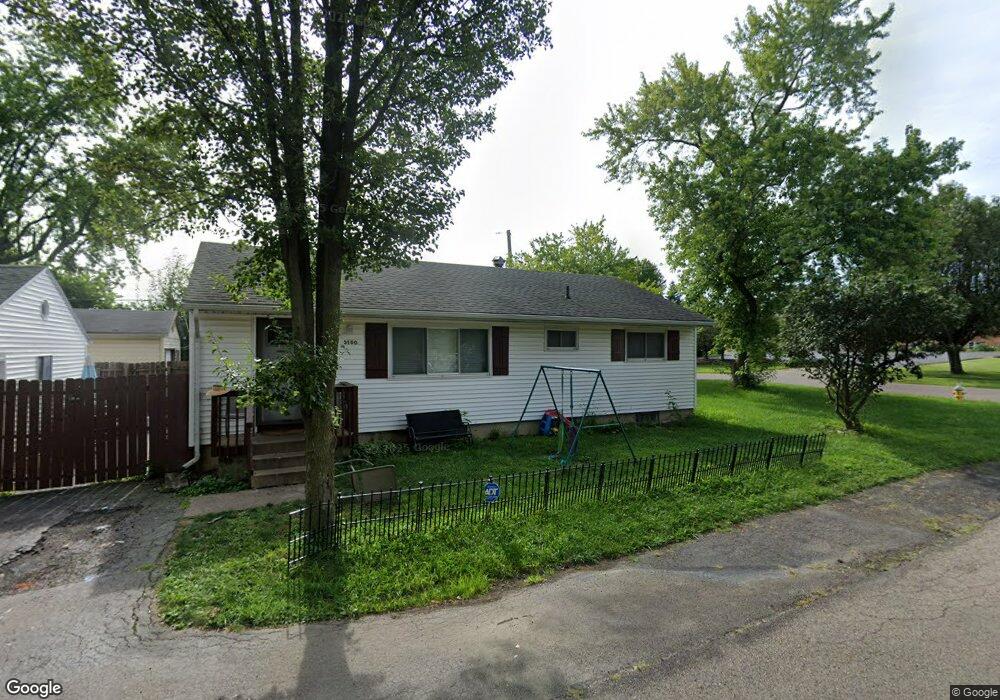
3150 Sutton Ave Dayton, OH 45429
Estimated Value: $173,520 - $194,000
3
Beds
1
Bath
1,008
Sq Ft
$183/Sq Ft
Est. Value
About This Home
This home is located at 3150 Sutton Ave, Dayton, OH 45429 and is currently estimated at $184,630, approximately $183 per square foot. 3150 Sutton Ave is a home located in Montgomery County with nearby schools including Beavertown Elementary School, Kettering Middle School, and Kettering Fairmont High School.
Ownership History
Date
Name
Owned For
Owner Type
Purchase Details
Closed on
Jul 1, 2020
Sold by
Evolveassets One Llc
Bought by
Lawson Zach and Lawson Zachariah
Current Estimated Value
Home Financials for this Owner
Home Financials are based on the most recent Mortgage that was taken out on this home.
Original Mortgage
$122,735
Outstanding Balance
$108,103
Interest Rate
3.1%
Mortgage Type
FHA
Estimated Equity
$76,527
Purchase Details
Closed on
Sep 24, 2019
Sold by
Felkley Ted and Us Bank National Association
Bought by
Evolve Assets One Llc
Purchase Details
Closed on
Nov 1, 2002
Sold by
Felkley Ted M
Bought by
Felkley Ted M and Felkley Donna L
Home Financials for this Owner
Home Financials are based on the most recent Mortgage that was taken out on this home.
Original Mortgage
$65,600
Interest Rate
5.12%
Purchase Details
Closed on
Jan 28, 2002
Sold by
Estate Of Delores J Felkley
Bought by
Manzo Pamela N and Felkley Ted M
Create a Home Valuation Report for This Property
The Home Valuation Report is an in-depth analysis detailing your home's value as well as a comparison with similar homes in the area
Home Values in the Area
Average Home Value in this Area
Purchase History
| Date | Buyer | Sale Price | Title Company |
|---|---|---|---|
| Lawson Zach | $125,000 | Triad Title Agency Inc | |
| Evolve Assets One Llc | $67,000 | None Available | |
| Felkley Ted M | -- | -- | |
| Felkley Ted M | $42,000 | -- | |
| Manzo Pamela N | -- | -- |
Source: Public Records
Mortgage History
| Date | Status | Borrower | Loan Amount |
|---|---|---|---|
| Open | Lawson Zach | $122,735 | |
| Previous Owner | Felkley Ted M | $65,600 |
Source: Public Records
Tax History
| Year | Tax Paid | Tax Assessment Tax Assessment Total Assessment is a certain percentage of the fair market value that is determined by local assessors to be the total taxable value of land and additions on the property. | Land | Improvement |
|---|---|---|---|---|
| 2025 | $2,640 | $41,220 | $9,280 | $31,940 |
| 2024 | $2,565 | $41,220 | $9,280 | $31,940 |
| 2023 | $2,565 | $41,220 | $9,280 | $31,940 |
| 2022 | $2,483 | $31,550 | $7,080 | $24,470 |
| 2021 | $2,348 | $31,550 | $7,080 | $24,470 |
| 2020 | $2,304 | $31,550 | $7,080 | $24,470 |
| 2019 | $1,758 | $29,980 | $7,080 | $22,900 |
| 2018 | $1,768 | $29,980 | $7,080 | $22,900 |
| 2017 | $1,629 | $29,980 | $7,080 | $22,900 |
| 2016 | $1,653 | $29,000 | $7,080 | $21,920 |
| 2015 | $1,580 | $29,000 | $7,080 | $21,920 |
| 2014 | $1,580 | $29,000 | $7,080 | $21,920 |
| 2012 | -- | $28,590 | $7,130 | $21,460 |
Source: Public Records
Map
Nearby Homes
- 3019 Larue Dr
- 1851 Beaverton Dr
- 3332 Marshall Rd
- 1241 Devon Ave
- 2758 Sutton Ave
- 3164 Cobblestone Ln Unit 103164
- 3700 Lisbon St
- 1820 Boesel Ave
- 1141 Devon Ave
- 1138 Sharon Ave
- 3801 Valleywood Dr
- 1912 Echo Wood Ct
- 1629 Beaver Creek Ln
- 2917 Acorn Dr
- 1436 Glenn Abbey Dr
- 2408 Homeland Ct
- 3209 Carrier Ave
- 1525 Farrington Dr
- 1136 Dexter Ave
- 2425 Wilmington Pike
- 1625 Brownleigh Rd
- 1553 Brownleigh Rd
- 3153 Beaver Ave
- 1645 Brownleigh Rd
- 3145 Beaver Ave
- 3137 Sutton Ave
- 3128 Sutton Ave
- 3133 Sutton Ave
- 1617 Tremont Ave
- 3148 Larue Dr
- 1625 Tremont Ave
- 3140 Larue Dr
- 1633 Tremont Ave
- 3120 Sutton Ave
- 3156 Beaver Ave
- 3152 Beaver Ave
- 3136 Larue Dr
- 3125 Sutton Ave
- 3160 Beaver Ave
- 3148 Beaver Ave
Your Personal Tour Guide
Ask me questions while you tour the home.