3150 Walnut Bend Ln Unit 519 Houston, TX 77042
Westchase NeighborhoodEstimated Value: $97,049 - $124,000
1
Bed
1
Bath
839
Sq Ft
$130/Sq Ft
Est. Value
About This Home
This home is located at 3150 Walnut Bend Ln Unit 519, Houston, TX 77042 and is currently estimated at $108,762, approximately $129 per square foot. 3150 Walnut Bend Ln Unit 519 is a home located in Harris County with nearby schools including Outley Elementary School, O'Donnell Middle School, and Budewig Intermediate School.
Ownership History
Date
Name
Owned For
Owner Type
Purchase Details
Closed on
Mar 24, 2016
Sold by
Guerra Teresa Carrera De and Guerra Carlos
Bought by
Alanis Jose
Current Estimated Value
Purchase Details
Closed on
Dec 6, 2011
Sold by
Federal Home Loan Mortgage Corporation
Bought by
Deguerra Teresa Carrera and Guerra Carlos
Purchase Details
Closed on
Sep 6, 2011
Sold by
Hildabolt Christine and Jpmorgan Chase Bank National A
Bought by
Federal Home Loan Mortgage Corporation
Purchase Details
Closed on
Apr 26, 2004
Sold by
Earhart Interests Llc and Horton Cecily
Bought by
Hildebolt Christine
Home Financials for this Owner
Home Financials are based on the most recent Mortgage that was taken out on this home.
Original Mortgage
$30,400
Interest Rate
5.38%
Mortgage Type
Purchase Money Mortgage
Create a Home Valuation Report for This Property
The Home Valuation Report is an in-depth analysis detailing your home's value as well as a comparison with similar homes in the area
Home Values in the Area
Average Home Value in this Area
Purchase History
| Date | Buyer | Sale Price | Title Company |
|---|---|---|---|
| Alanis Jose | -- | Alamo Title Company | |
| Deguerra Teresa Carrera | -- | Texas American Title Company | |
| Federal Home Loan Mortgage Corporation | $16,003 | None Available | |
| Hildebolt Christine | -- | Alamo Title Company |
Source: Public Records
Mortgage History
| Date | Status | Borrower | Loan Amount |
|---|---|---|---|
| Previous Owner | Hildebolt Christine | $30,400 |
Source: Public Records
Tax History Compared to Growth
Tax History
| Year | Tax Paid | Tax Assessment Tax Assessment Total Assessment is a certain percentage of the fair market value that is determined by local assessors to be the total taxable value of land and additions on the property. | Land | Improvement |
|---|---|---|---|---|
| 2025 | $2,213 | $92,428 | $17,561 | $74,867 |
| 2024 | $2,213 | $97,404 | $18,507 | $78,897 |
| 2023 | $2,213 | $105,021 | $19,954 | $85,067 |
| 2022 | $2,224 | $86,000 | $16,340 | $69,660 |
| 2021 | $1,841 | $75,412 | $14,328 | $61,084 |
| 2020 | $1,876 | $74,195 | $14,097 | $60,098 |
| 2019 | $1,604 | $60,442 | $11,484 | $48,958 |
| 2018 | $771 | $58,000 | $11,533 | $46,467 |
| 2017 | $1,524 | $58,000 | $11,533 | $46,467 |
| 2016 | $1,386 | $56,728 | $10,778 | $45,950 |
| 2015 | $68 | $54,935 | $10,438 | $44,497 |
| 2014 | $68 | $43,613 | $8,286 | $35,327 |
Source: Public Records
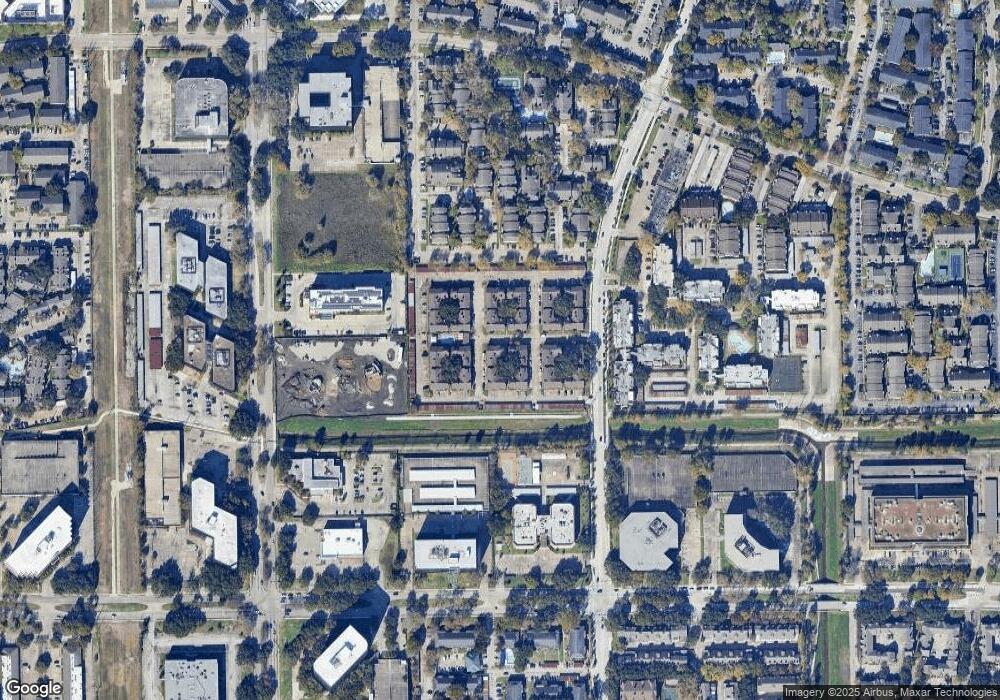
Map
Nearby Homes
- 3130 Walnut Bend Ln Unit 406
- 3130 Walnut Bend Ln Unit 401
- 3100 Walnut Bend Ln Unit 116
- 3100 Walnut Bend Ln Unit 309
- 3100 Walnut Bend Ln Unit 113
- 3085 Walnut Bend Ln Unit 35
- 3085 Walnut Bend Ln Unit 12
- 3085 Walnut Bend Ln Unit 11
- 3015 Walnut Bend Ln Unit 35
- 3015 Walnut Bend Ln Unit 31
- 3015 Walnut Bend Ln Unit 37
- 3005 Walnut Bend Ln Unit 12
- 3055 Walnut Bend Ln Unit 21
- 3035 Walnut Bend Ln Unit 15
- 3035 Walnut Bend Ln Unit 33
- 3035 Walnut Bend Ln Unit 35
- 10855 Meadowglen Ln Unit 901
- 10855 Meadowglen Ln Unit 1030
- 10855 Meadowglen Ln Unit 1009
- 10855 Meadowglen Ln Unit 729
- 3150 Walnut Bend Ln Unit 606
- 3150 Walnut Bend Ln Unit 601
- 3150 Walnut Bend Ln Unit 614
- 3150 Walnut Bend Ln Unit 502
- 3150 Walnut Bend Ln Unit 609
- 3150 Walnut Bend Ln Unit 510
- 3150 Walnut Bend Ln Unit 608
- 3150 Walnut Bend Ln Unit 607
- 3150 Walnut Bend Ln Unit 612
- 3150 Walnut Bend Ln Unit 611
- 3150 Walnut Bend Ln Unit 610
- 3150 Walnut Bend Ln Unit 605
- 3150 Walnut Bend Ln Unit 604
- 3150 Walnut Bend Ln Unit 603
- 3150 Walnut Bend Ln Unit 602
- 3150 Walnut Bend Ln Unit 624
- 3150 Walnut Bend Ln Unit 623
- 3150 Walnut Bend Ln Unit 622
- 3150 Walnut Bend Ln Unit 621
- 3150 Walnut Bend Ln Unit 620