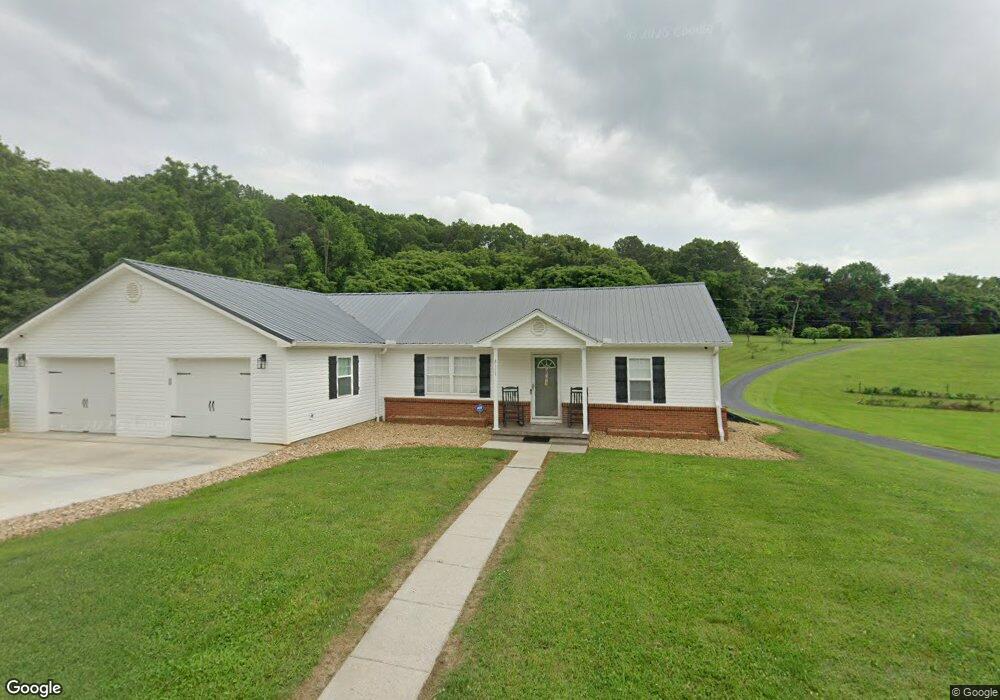
3151 Cherokee Dr Morristown, TN 37814
Estimated Value: $146,000 - $323,000
--
Bed
1
Bath
2,086
Sq Ft
$113/Sq Ft
Est. Value
About This Home
This home is located at 3151 Cherokee Dr, Morristown, TN 37814 and is currently estimated at $235,229, approximately $112 per square foot. 3151 Cherokee Dr is a home located in Hamblen County with nearby schools including West Elementary School, Lincoln Heights Middle School, and Morristown West High School.
Ownership History
Date
Name
Owned For
Owner Type
Purchase Details
Closed on
Feb 19, 2019
Sold by
Darnell Robert D and Darnell Teresa A
Bought by
Darnell Robert D and Darnell Teresa A
Current Estimated Value
Purchase Details
Closed on
Feb 21, 2008
Sold by
Branton Donna
Bought by
Darnell Robert D
Purchase Details
Closed on
Aug 3, 1999
Sold by
Greene Adren
Bought by
Henry Cook
Purchase Details
Closed on
Jun 17, 1999
Sold by
Graves Ben
Bought by
Adren Greene
Purchase Details
Closed on
Jul 27, 1998
Sold by
Branton Charles
Bought by
Graves Ben
Purchase Details
Closed on
Sep 3, 1997
Sold by
Charles Branton and Charles Branton
Bought by
Carey Billie
Purchase Details
Closed on
Jul 10, 1997
Bought by
Branton Donna
Purchase Details
Closed on
Mar 17, 1997
Bought by
Branton Donna
Purchase Details
Closed on
Jan 11, 1995
Sold by
Branton John L and Branton Willie
Bought by
Branton Charles
Purchase Details
Closed on
Oct 4, 1967
Bought by
Branton John L and Branton Willie
Create a Home Valuation Report for This Property
The Home Valuation Report is an in-depth analysis detailing your home's value as well as a comparison with similar homes in the area
Home Values in the Area
Average Home Value in this Area
Purchase History
| Date | Buyer | Sale Price | Title Company |
|---|---|---|---|
| Darnell Robert D | -- | None Available | |
| Darnell Robert D | $62,500 | -- | |
| Henry Cook | $60,016 | -- | |
| Adren Greene | $25,000 | -- | |
| Graves Ben | $13,900 | -- | |
| Carey Billie | $80,000 | -- | |
| Branton Donna | -- | -- | |
| Branton Donna | $44,500 | -- | |
| Branton Charles | $27,300 | -- | |
| Branton John L | -- | -- |
Source: Public Records
Tax History Compared to Growth
Tax History
| Year | Tax Paid | Tax Assessment Tax Assessment Total Assessment is a certain percentage of the fair market value that is determined by local assessors to be the total taxable value of land and additions on the property. | Land | Improvement |
|---|---|---|---|---|
| 2024 | $657 | $33,350 | $4,425 | $28,925 |
| 2023 | $405 | $20,575 | $0 | $0 |
| 2022 | $405 | $20,575 | $4,425 | $16,150 |
| 2021 | $405 | $20,575 | $4,425 | $16,150 |
| 2020 | $405 | $20,575 | $4,425 | $16,150 |
| 2019 | $313 | $14,700 | $4,425 | $10,275 |
| 2018 | $313 | $14,700 | $4,425 | $10,275 |
| 2017 | $313 | $14,700 | $4,425 | $10,275 |
| 2016 | $293 | $14,700 | $4,425 | $10,275 |
| 2015 | $272 | $14,700 | $4,425 | $10,275 |
| 2014 | -- | $14,700 | $4,425 | $10,275 |
| 2013 | -- | $17,850 | $0 | $0 |
Source: Public Records
Map
Nearby Homes
- 189 Adley St
- 2241 Le Conte St
- 1068 Mimosa Dr
- 0 Mcbride Rd
- 1184 Mimosa Dr
- TBD Boatmans Mountain Rd
- 1171 Pine Haven Dr
- 877 Pine Haven Dr
- 108 Sigmon St
- Lot 295 Inlet Cove
- Lot 289 Inlet Cove
- Lot 267 Waterview Way
- 2950 Boatmans Mountain Rd
- 29+ACRES Boatmans Mountain
- 2728 Conrad Dr
- 1361 Appalachian Trace
- 460 Noes Chapel Rd
- 440 Noes Chapel Rd
- 3152 Cherokee Dr
- 3150 Cherokee Dr
- 3156 Cherokee Dr
- 3125 Cherokee Dr
- 3160 Cherokee Dr
- 3163 Cherokee Dr
- 3110 Cherokee Dr
- 3203 Cherokee Dr
- 3220 Cherokee Dr
- 3108 Cherokee Dr
- 3164 Turley Bridge Rd
- 3211 Cherokee Dr
- 3217 Cherokee Dr
- 3080 Cherokee Dr
- 3210 Turley Bridge Rd
- 3062 Cherokee Dr
- 3204 Turley Bridge Rd
- 3241 Cherokee Dr
- 3222 Turley Bridge Rd
- 3206 Turley Bridge Rd