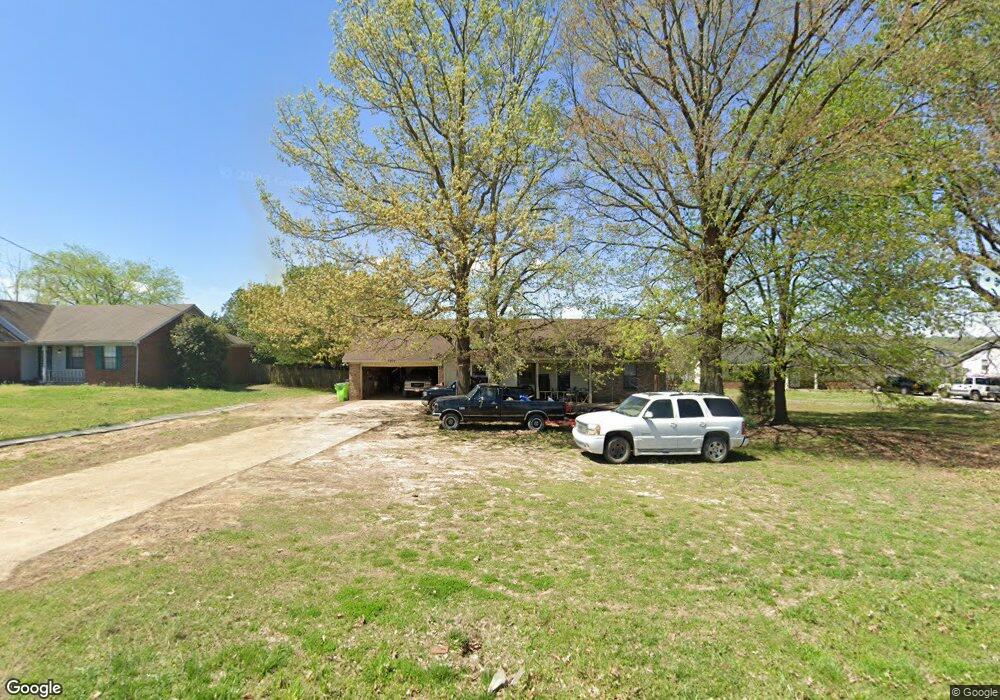
3151 Wilkinsville Rd Drummonds, TN 38023
Estimated Value: $218,159 - $268,000
--
Bed
2
Baths
1,426
Sq Ft
$169/Sq Ft
Est. Value
About This Home
This home is located at 3151 Wilkinsville Rd, Drummonds, TN 38023 and is currently estimated at $240,790, approximately $168 per square foot. 3151 Wilkinsville Rd is a home located in Tipton County with nearby schools including Drummonds Elementary School, Munford Middle School, and Munford High School.
Ownership History
Date
Name
Owned For
Owner Type
Purchase Details
Closed on
May 4, 2007
Sold by
Gillihan Charlotte N
Bought by
Miller Jeremy A
Current Estimated Value
Purchase Details
Closed on
Dec 13, 2004
Sold by
Liquidation Properties Inc
Bought by
Gillihan Charlotte N
Home Financials for this Owner
Home Financials are based on the most recent Mortgage that was taken out on this home.
Original Mortgage
$93,600
Interest Rate
5.67%
Purchase Details
Closed on
Jun 16, 2004
Bought by
Liquidation Properties Inc
Purchase Details
Closed on
Mar 23, 2004
Sold by
Walker William L
Bought by
Union Planters Bank
Purchase Details
Closed on
Apr 3, 1995
Sold by
Albert Bean
Bought by
Walker William L
Purchase Details
Closed on
Jun 14, 1994
Bought by
Bean Albert and Bean Ruth
Purchase Details
Closed on
Dec 23, 1992
Bought by
Bean Albert L and Jesse Middleton
Purchase Details
Closed on
Aug 25, 1989
Bought by
Densford John Alan and Densford Josep
Create a Home Valuation Report for This Property
The Home Valuation Report is an in-depth analysis detailing your home's value as well as a comparison with similar homes in the area
Home Values in the Area
Average Home Value in this Area
Purchase History
| Date | Buyer | Sale Price | Title Company |
|---|---|---|---|
| Miller Jeremy A | $115,000 | -- | |
| Gillihan Charlotte N | $117,000 | -- | |
| Liquidation Properties Inc | $79,100 | -- | |
| Union Planters Bank | $79,125 | -- | |
| Walker William L | $79,300 | -- | |
| Bean Albert | -- | -- | |
| Bean Albert L | -- | -- | |
| Densford John Alan | -- | -- |
Source: Public Records
Mortgage History
| Date | Status | Borrower | Loan Amount |
|---|---|---|---|
| Previous Owner | Densford John Alan | $93,600 | |
| Previous Owner | Densford John Alan | $23,400 |
Source: Public Records
Tax History Compared to Growth
Tax History
| Year | Tax Paid | Tax Assessment Tax Assessment Total Assessment is a certain percentage of the fair market value that is determined by local assessors to be the total taxable value of land and additions on the property. | Land | Improvement |
|---|---|---|---|---|
| 2024 | $789 | $51,875 | $6,350 | $45,525 |
| 2023 | $789 | $51,875 | $6,350 | $45,525 |
| 2022 | $741 | $36,300 | $4,675 | $31,625 |
| 2021 | $741 | $36,300 | $4,675 | $31,625 |
| 2020 | $740 | $36,300 | $4,675 | $31,625 |
| 2019 | $705 | $29,150 | $4,675 | $24,475 |
| 2018 | $705 | $29,150 | $4,675 | $24,475 |
| 2017 | $705 | $29,150 | $4,675 | $24,475 |
| 2016 | $705 | $29,150 | $4,675 | $24,475 |
| 2015 | $705 | $29,150 | $4,675 | $24,475 |
| 2014 | $704 | $29,140 | $0 | $0 |
Source: Public Records
Map
Nearby Homes
- 1336 Mathis Rd
- 1461 Armstrong Rd
- 231 Country Meadow Ln
- 400 Whippoorwill Cir
- 856 Reed Cir
- 5391 Simmons Rd
- 97 Rachel Cove
- 121 Reed Cir
- 0 Reed Cir Unit 10192357
- 544 Rachel Shankle Dr
- 483 Rachel Shankle Dr
- 155 Pwr Loop
- 288 W Rae Dr
- 1739 Tate Rd
- 321 Switchgrass Cove
- 343 Pwr Loop
- 0 Simmons Rd Unit 10197057
- 243 Morgan Way
- 0 Ray Bluff Rd
- 0 Hickory Ln
- 3171 Wilkinsville Rd
- 3141 Wilkinsville Rd
- 3189 Wilkinsville Rd
- 3131 Wilkinsville Rd
- 3119 Wilkinsville Rd
- 3107 Wilkinsville Rd
- 3239 Wilkinsville Rd
- 3097 Wilkinsville Rd
- 3220 Wilkinsville Rd
- 3075 Wilkinsville Rd
- 3055 Wilkinsville Rd
- 3025 Wilkinsville Rd
- 3355 Wilkinsville Rd
- 70 Vickie St
- 114 Curt St
- 80 Curt St
- 0 Wilkinsville Rd Unit 3249480
- 0 Wilkinsville Rd
- 0 Wilkinsville Rd Unit RTC3027085
- 0 Wilkinsville Rd Unit RTC3027083