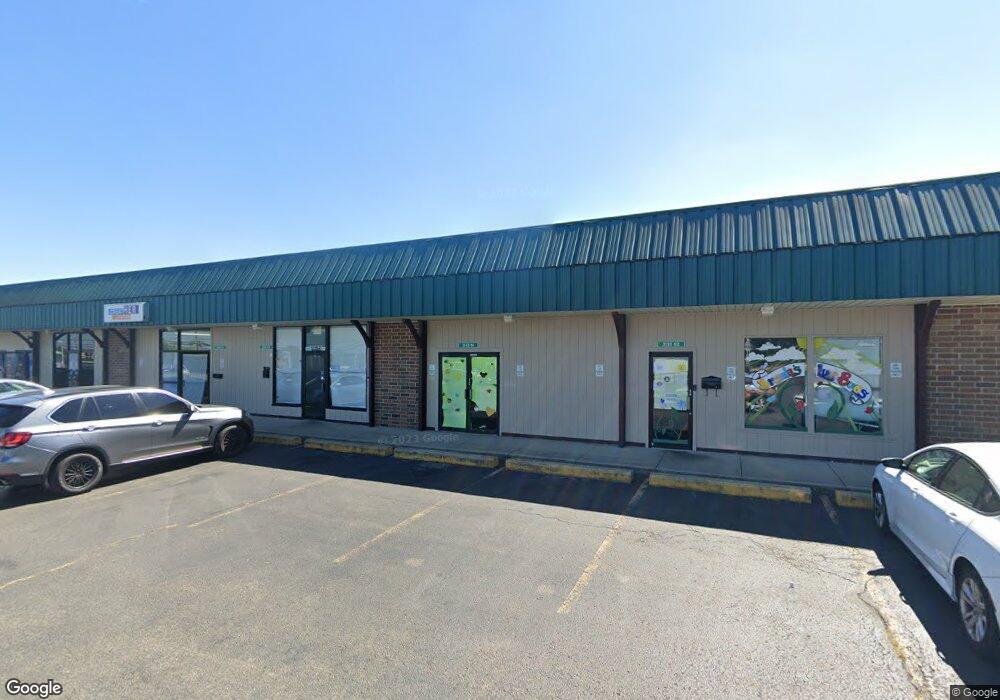
3152 Lighthouse Dr Unit Suite C1 Fairfield, OH 45014
Estimated Value: $937,696
--
Bed
--
Bath
9,800
Sq Ft
$96/Sq Ft
Est. Value
About This Home
This home is located at 3152 Lighthouse Dr Unit Suite C1, Fairfield, OH 45014 and is currently estimated at $937,696, approximately $95 per square foot. 3152 Lighthouse Dr Unit Suite C1 is a home located in Butler County with nearby schools including Compass Elementary School, Creekside Middle School, and Fairfield Senior High School.
Ownership History
Date
Name
Owned For
Owner Type
Purchase Details
Closed on
May 16, 2013
Sold by
Lighthouse Centre Llc
Bought by
Mind Teck Solutions Llc
Current Estimated Value
Home Financials for this Owner
Home Financials are based on the most recent Mortgage that was taken out on this home.
Original Mortgage
$356,000
Outstanding Balance
$251,242
Interest Rate
3.39%
Mortgage Type
Commercial
Estimated Equity
$686,454
Purchase Details
Closed on
Dec 28, 2005
Sold by
Schwab David S
Bought by
Lighthouse Centre Llc
Purchase Details
Closed on
Aug 2, 1999
Sold by
Broshear Robert F and Broshear Joan
Bought by
Schwab David S and T & C Properties Llc
Home Financials for this Owner
Home Financials are based on the most recent Mortgage that was taken out on this home.
Original Mortgage
$260,000
Interest Rate
7.69%
Mortgage Type
Commercial
Purchase Details
Closed on
Feb 1, 1985
Create a Home Valuation Report for This Property
The Home Valuation Report is an in-depth analysis detailing your home's value as well as a comparison with similar homes in the area
Home Values in the Area
Average Home Value in this Area
Purchase History
| Date | Buyer | Sale Price | Title Company |
|---|---|---|---|
| Mind Teck Solutions Llc | $391,000 | None Available | |
| Lighthouse Centre Llc | -- | None Available | |
| Schwab David S | -- | None Available | |
| Schwab David S | $360,000 | -- | |
| -- | $160,000 | -- |
Source: Public Records
Mortgage History
| Date | Status | Borrower | Loan Amount |
|---|---|---|---|
| Open | Mind Teck Solutions Llc | $356,000 | |
| Previous Owner | Schwab David S | $260,000 |
Source: Public Records
Tax History Compared to Growth
Tax History
| Year | Tax Paid | Tax Assessment Tax Assessment Total Assessment is a certain percentage of the fair market value that is determined by local assessors to be the total taxable value of land and additions on the property. | Land | Improvement |
|---|---|---|---|---|
| 2024 | $8,715 | $155,710 | $63,000 | $92,710 |
| 2023 | $8,718 | $155,710 | $63,000 | $92,710 |
| 2022 | $9,361 | $155,710 | $63,000 | $92,710 |
| 2021 | $8,468 | $155,710 | $63,000 | $92,710 |
| 2020 | $8,768 | $155,710 | $63,000 | $92,710 |
| 2019 | $10,906 | $126,320 | $67,200 | $59,120 |
| 2018 | $7,698 | $126,320 | $67,200 | $59,120 |
| 2017 | $8,096 | $126,320 | $67,200 | $59,120 |
| 2016 | $8,229 | $126,320 | $67,200 | $59,120 |
| 2015 | $7,878 | $126,320 | $67,200 | $59,120 |
| 2014 | $8,208 | $126,320 | $67,200 | $59,120 |
| 2013 | $8,208 | $152,160 | $67,200 | $84,960 |
Source: Public Records
Map
Nearby Homes
- 3404 Woodside Dr
- 4351 Whitmore Ln
- 171 Highridge Ct Unit 171
- 62 Ironwood Ct
- 15 Overlook Ct
- 7 Darby Ct Unit 67
- 4 Old Duxbury Ct
- 5051 Dixie Hwy
- 20 N Applewood Ct Unit 151
- 4 Shoal Meadows Ct
- 74 Applewood Dr
- 40 Applewood Dr Unit 40
- 48 Applewood Dr Unit 48
- 3032 Woodside Dr
- 58 Twin Lakes Dr
- 62 Twin Lakes Dr
- 5890 Kay Dr
- 0 Port Union Rd Unit 938851
- 5584 Venus Ln
- 2778 Resor Rd
- 3152 Lighthouse Dr Unit C
- 3152 Lighthouse Dr Unit C1
- 6151 Dixie Hwy
- 6141 Dixie Hwy
- 3195 Lighthouse Dr
- 3251 Roesch Blvd Unit 126
- 3251 Roesch Blvd Unit 127
- 3251 Roesch Blvd Unit 128
- 3251 Roesch Blvd Unit 129
- 3241 Roesch Blvd Unit A
- 3241 Roesch Blvd
- 3241 Roesch Blvd
- 3241 Roesch Blvd
- 3241 Roesch Blvd
- 3241 Roesch Blvd
- 3241 Roesch Blvd
- 3241 Roesch Blvd
- 3241 Roesch Blvd
- 3241 Roesch Blvd
- 3241 Roesch Blvd