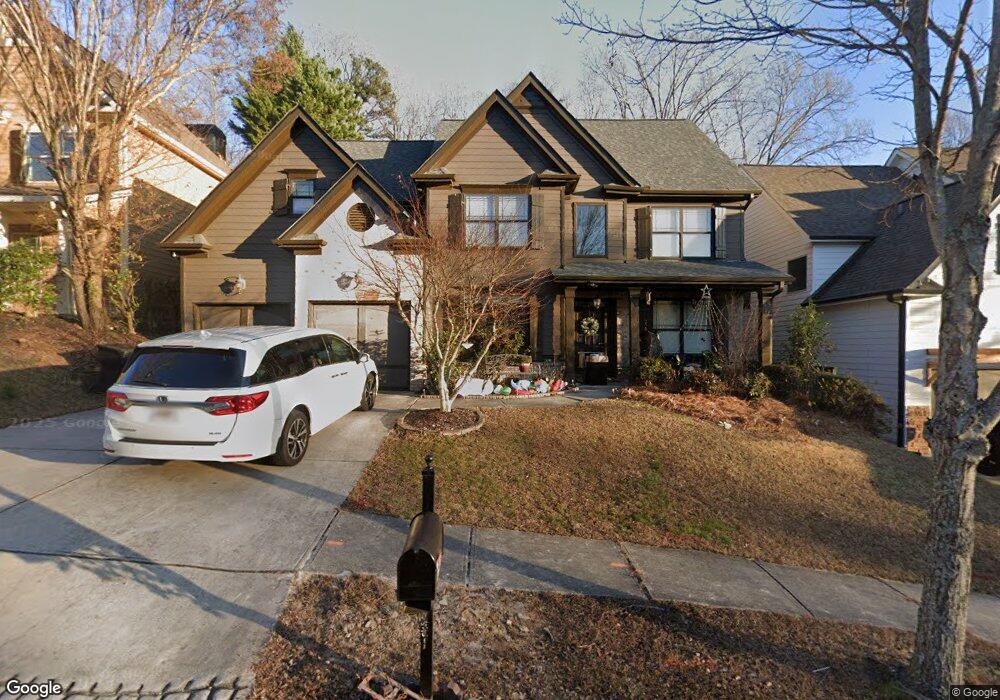
3153 Little Bear Ln Buford, GA 30519
Estimated Value: $477,138 - $530,000
5
Beds
3
Baths
2,847
Sq Ft
$177/Sq Ft
Est. Value
About This Home
This home is located at 3153 Little Bear Ln, Buford, GA 30519 and is currently estimated at $503,035, approximately $176 per square foot. 3153 Little Bear Ln is a home located in Gwinnett County with nearby schools including Harmony Elementary School and Glenn C. Jones Middle School.
Ownership History
Date
Name
Owned For
Owner Type
Purchase Details
Closed on
Aug 8, 2017
Sold by
Vanvannguyen Quat Van
Bought by
Vanvannguyen Binh Van and Bui Tra My T
Current Estimated Value
Purchase Details
Closed on
Oct 6, 2010
Sold by
Federal Natl Mtg Assn Fnma
Bought by
Nguyen Binh and Nguyen Quat
Home Financials for this Owner
Home Financials are based on the most recent Mortgage that was taken out on this home.
Original Mortgage
$110,000
Interest Rate
4.36%
Mortgage Type
New Conventional
Purchase Details
Closed on
Jun 1, 2010
Sold by
Lns Metlife Hm
Bought by
Federal Natl Mtg Assn Fnma
Purchase Details
Closed on
Jul 28, 2006
Sold by
Bryan Mill Builders Llc
Bought by
James Kendrick and James Chandra
Home Financials for this Owner
Home Financials are based on the most recent Mortgage that was taken out on this home.
Original Mortgage
$61,250
Interest Rate
6.74%
Mortgage Type
New Conventional
Create a Home Valuation Report for This Property
The Home Valuation Report is an in-depth analysis detailing your home's value as well as a comparison with similar homes in the area
Home Values in the Area
Average Home Value in this Area
Purchase History
| Date | Buyer | Sale Price | Title Company |
|---|---|---|---|
| Vanvannguyen Binh Van | -- | -- | |
| Nguyen Binh | -- | -- | |
| Federal Natl Mtg Assn Fnma | -- | -- | |
| Metlife Hm Lns | $259,397 | -- | |
| James Kendrick | $306,300 | -- |
Source: Public Records
Mortgage History
| Date | Status | Borrower | Loan Amount |
|---|---|---|---|
| Previous Owner | Nguyen Binh | $110,000 | |
| Previous Owner | James Kendrick | $61,250 |
Source: Public Records
Tax History
| Year | Tax Paid | Tax Assessment Tax Assessment Total Assessment is a certain percentage of the fair market value that is determined by local assessors to be the total taxable value of land and additions on the property. | Land | Improvement |
|---|---|---|---|---|
| 2025 | -- | $197,520 | $40,000 | $157,520 |
| 2024 | $5,181 | $173,800 | $34,400 | $139,400 |
| 2023 | $5,181 | $143,880 | $34,400 | $109,480 |
| 2022 | $4,528 | $143,880 | $34,400 | $109,480 |
| 2021 | $4,128 | $121,520 | $29,200 | $92,320 |
| 2020 | $3,971 | $112,960 | $29,200 | $83,760 |
| 2019 | $3,745 | $108,360 | $24,800 | $83,560 |
| 2018 | $3,749 | $108,360 | $24,800 | $83,560 |
| 2016 | $3,461 | $95,280 | $12,400 | $82,880 |
| 2015 | $3,499 | $95,280 | $12,400 | $82,880 |
| 2014 | $2,618 | $70,080 | $12,400 | $57,680 |
Source: Public Records
Map
Nearby Homes
- 4165 Bradford Walk Trail
- 3200 Golden Spring Dr
- 3721 Bogan Mill Rd
- 3561 Bogan Mill Rd
- 3075 Andover Trail
- 3761 Andover Way
- 3713 Golden Ive Dr
- 3570 Bogan Mill Rd NE
- 3680 Ridge Rd
- 3675 Ridgehurst Ln
- 3421 Lindenridge Dr
- 3530 Rivers End Place
- 3431 Blaisdell Rd
- 3395 Reed Mill Dr
- 3411 Lindenridge Dr
- 3458 Crayton Glen Way
- 3408 Hamilton Mill Rd
- 2335 Morgan Place Dr
- 3488 Hamilton Mill Rd
- 3525 Hamilton Mill Rd
- 3143 Little Bear Ln
- 3163 Little Bear Ln
- 0 Little Bear Ln Unit 8826303
- 3133 Little Bear Ln
- 3173 Little Bear Ln
- 3191 MacY Lee Ct
- 3142 Little Bear Ln
- 3172 Little Bear Ln
- 3183 Little Bear Ln
- 3123 Little Bear Ln
- 3132 Little Bear Ln
- 3132 Little Bear Ln Unit GA14819
- 3132 Little Bear Ln Unit GA1481
- 3181 MacY Lee Ct
- 3192 Little Bear Ln
- 3193 Little Bear Ln Unit 24
- 3193 Little Bear Ln
- 3180 MacY Lee Ct
- 3122 Little Bear Ln
- 3171 MacY Lee Ct
Your Personal Tour Guide
Ask me questions while you tour the home.