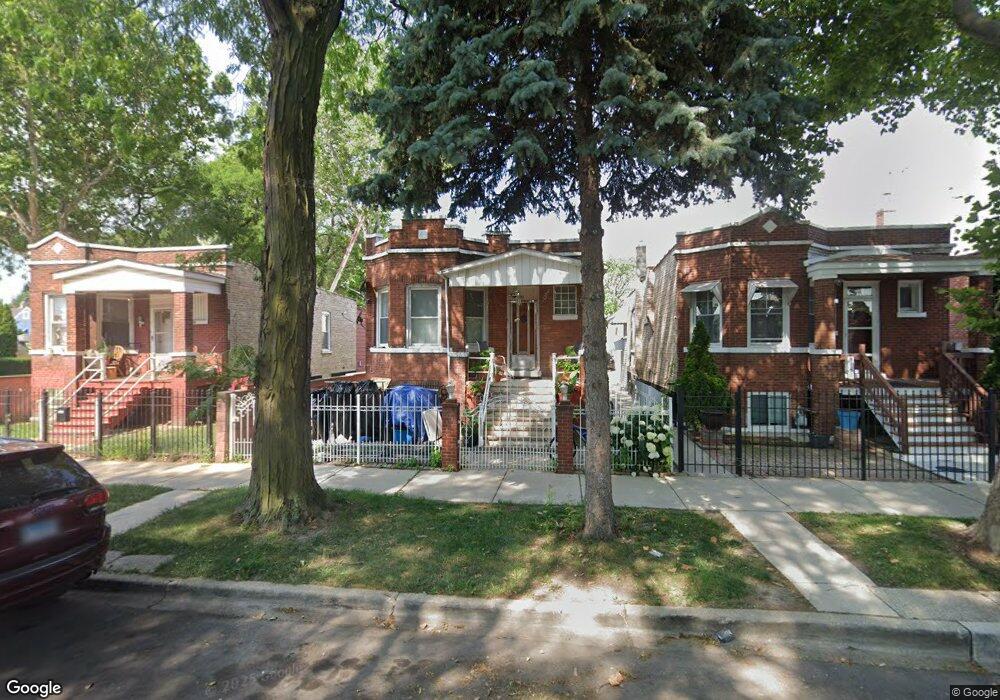
3154 S Springfield Ave Chicago, IL 60623
Little Village NeighborhoodEstimated Value: $244,481 - $269,000
5
Beds
2
Baths
1,100
Sq Ft
$237/Sq Ft
Est. Value
About This Home
This home is located at 3154 S Springfield Ave, Chicago, IL 60623 and is currently estimated at $260,620, approximately $236 per square foot. 3154 S Springfield Ave is a home located in Cook County with nearby schools including Ortiz De Dominguez Elementary School, Gary Elementary School, and Grace Lutheran Academy.
Ownership History
Date
Name
Owned For
Owner Type
Purchase Details
Closed on
May 16, 2018
Sold by
Garcia Luz E and Garcia Jose L
Bought by
Garcia Jose L and Garcia Luz E
Current Estimated Value
Purchase Details
Closed on
Feb 18, 2017
Sold by
Arenas Florinda
Bought by
Garcia Luz C
Home Financials for this Owner
Home Financials are based on the most recent Mortgage that was taken out on this home.
Original Mortgage
$92,720
Outstanding Balance
$77,921
Interest Rate
4.75%
Mortgage Type
New Conventional
Estimated Equity
$182,699
Purchase Details
Closed on
Jun 28, 1994
Sold by
Lopez Rafael and Lopez Rosalinda
Bought by
Arenas David and Arenas Florinda
Home Financials for this Owner
Home Financials are based on the most recent Mortgage that was taken out on this home.
Original Mortgage
$95,000
Interest Rate
8.38%
Create a Home Valuation Report for This Property
The Home Valuation Report is an in-depth analysis detailing your home's value as well as a comparison with similar homes in the area
Home Values in the Area
Average Home Value in this Area
Purchase History
| Date | Buyer | Sale Price | Title Company |
|---|---|---|---|
| Garcia Jose L | -- | Chicago Title Insurance Comp | |
| Garcia Luz C | $116,000 | Attorney | |
| Arenas David | $100,000 | -- |
Source: Public Records
Mortgage History
| Date | Status | Borrower | Loan Amount |
|---|---|---|---|
| Open | Garcia Luz C | $92,720 | |
| Previous Owner | Arenas David | $95,000 |
Source: Public Records
Tax History Compared to Growth
Tax History
| Year | Tax Paid | Tax Assessment Tax Assessment Total Assessment is a certain percentage of the fair market value that is determined by local assessors to be the total taxable value of land and additions on the property. | Land | Improvement |
|---|---|---|---|---|
| 2024 | $2,538 | $19,700 | $5,481 | $14,219 |
| 2023 | $220 | $18,001 | $4,442 | $13,559 |
| 2022 | $220 | $18,001 | $4,442 | $13,559 |
| 2021 | $2,950 | $17,999 | $4,441 | $13,558 |
| 2020 | $1,698 | $10,726 | $4,441 | $6,285 |
| 2019 | $2,449 | $12,189 | $4,441 | $7,748 |
| 2018 | $2,408 | $12,189 | $4,441 | $7,748 |
| 2017 | $2,475 | $11,496 | $3,969 | $7,527 |
| 2016 | $652 | $11,496 | $3,969 | $7,527 |
| 2015 | $2,107 | $11,496 | $3,969 | $7,527 |
| 2014 | $2,017 | $10,869 | $3,780 | $7,089 |
| 2013 | $1,977 | $10,869 | $3,780 | $7,089 |
Source: Public Records
Map
Nearby Homes
- 3028 S Millard Ave
- 2807 S Hamlin Ave
- 4200 W 31st St
- 2845 S Kedvale Ave
- 3012 S Keeler Ave
- 2828 S Keeler Ave
- 2711 S Hamlin Ave
- 2652 S Komensky Ave
- 2849 S Kolin Ave
- 2632 S Millard Ave
- 3040 S Homan Ave
- 2541 S Springfield Ave
- 2841 S Trumbull Ave
- 2536 S Avers Ave
- 2817 S Trumbull Ave
- 2632 S Drake Ave
- 2802 S Homan Ave
- 2852 S Kenneth Ave
- 2757 S Homan Ave
- 1808 S Hamlin Ave
- 3150 S Springfield Ave
- 3158 S Springfield Ave
- 3148 S Springfield Ave
- 3144 S Springfield Ave
- 3142 S Springfield Ave
- 3200 S Springfield Ave
- 3138 S Springfield Ave
- 3155 S Harding Ave Unit 1
- 3153 S Harding Ave
- 3159 S Harding Ave
- 3204 S Springfield Ave
- 3149 S Harding Ave Unit 2
- 3147 S Harding Ave Unit 2
- 3143 S Harding Ave Unit 2
- 3136 S Springfield Ave
- 3155 S Springfield Ave
- 3206 S Springfield Ave
- 3151 S Springfield Ave
- 3159 S Springfield Ave
- 3149 S Springfield Ave