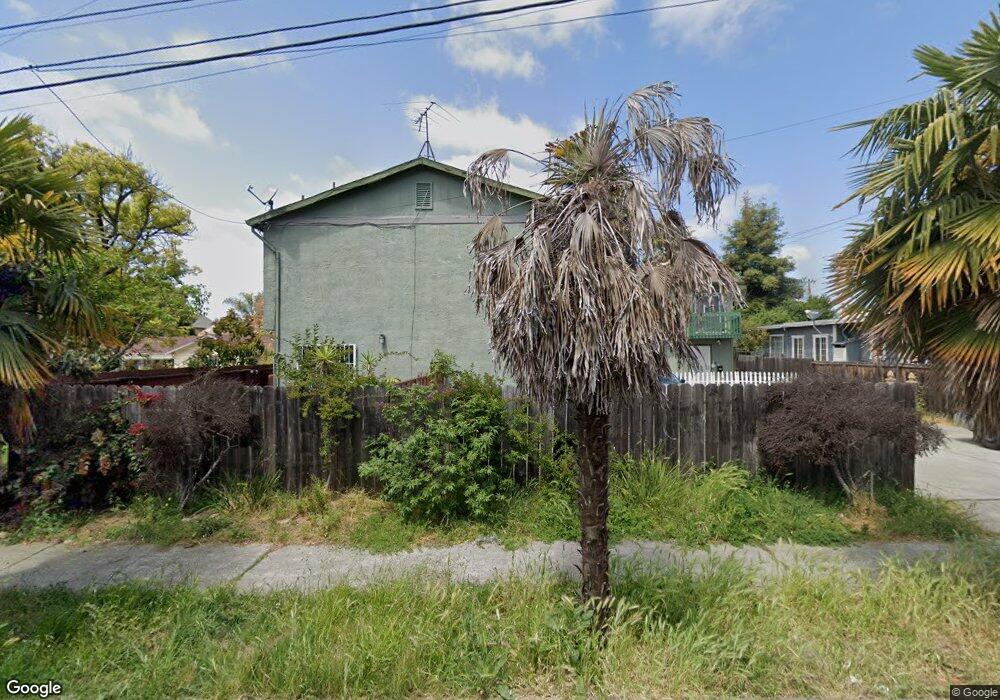
3155 Cuthbert Ave Unit 4 Oakland, CA 94602
School NeighborhoodEstimated Value: $419,000 - $520,000
2
Beds
2
Baths
1,073
Sq Ft
$443/Sq Ft
Est. Value
About This Home
This home is located at 3155 Cuthbert Ave Unit 4, Oakland, CA 94602 and is currently estimated at $475,315, approximately $442 per square foot. 3155 Cuthbert Ave Unit 4 is a home located in Alameda County with nearby schools including Fruitvale Elementary School, Bret Harte Middle School, and Skyline High School.
Ownership History
Date
Name
Owned For
Owner Type
Purchase Details
Closed on
Mar 31, 2006
Sold by
Che Insio
Bought by
Maisonet Sue
Current Estimated Value
Home Financials for this Owner
Home Financials are based on the most recent Mortgage that was taken out on this home.
Original Mortgage
$213,092
Outstanding Balance
$121,678
Interest Rate
6.25%
Mortgage Type
New Conventional
Estimated Equity
$353,637
Purchase Details
Closed on
Dec 30, 2003
Sold by
Che Soi Leng
Bought by
Che Insio
Purchase Details
Closed on
Jul 17, 2003
Sold by
Yue Hung Fai and Yue Yuet Lan
Bought by
Che Soi L
Home Financials for this Owner
Home Financials are based on the most recent Mortgage that was taken out on this home.
Original Mortgage
$172,000
Interest Rate
4.25%
Mortgage Type
Purchase Money Mortgage
Create a Home Valuation Report for This Property
The Home Valuation Report is an in-depth analysis detailing your home's value as well as a comparison with similar homes in the area
Home Values in the Area
Average Home Value in this Area
Purchase History
| Date | Buyer | Sale Price | Title Company |
|---|---|---|---|
| Maisonet Sue | $313,000 | Commonwealth Land Title Co | |
| Che Insio | -- | -- | |
| Che Soi L | $215,000 | Commonwealth Land Title Co |
Source: Public Records
Mortgage History
| Date | Status | Borrower | Loan Amount |
|---|---|---|---|
| Open | Maisonet Sue | $213,092 | |
| Previous Owner | Che Soi L | $172,000 |
Source: Public Records
Tax History
| Year | Tax Paid | Tax Assessment Tax Assessment Total Assessment is a certain percentage of the fair market value that is determined by local assessors to be the total taxable value of land and additions on the property. | Land | Improvement |
|---|---|---|---|---|
| 2025 | $6,024 | $420,701 | $128,310 | $299,391 |
| 2024 | $6,024 | $412,316 | $125,795 | $293,521 |
| 2023 | $6,353 | $411,097 | $123,329 | $287,768 |
| 2022 | $7,072 | $396,037 | $120,911 | $282,126 |
| 2021 | $6,701 | $388,137 | $118,541 | $276,596 |
| 2020 | $6,625 | $391,087 | $117,326 | $273,761 |
| 2019 | $6,337 | $383,421 | $115,026 | $268,395 |
| 2018 | $6,205 | $375,906 | $112,772 | $263,134 |
| 2017 | $5,952 | $368,538 | $110,561 | $257,977 |
| 2016 | $5,295 | $330,000 | $99,000 | $231,000 |
| 2015 | $3,557 | $200,000 | $60,000 | $140,000 |
| 2014 | $2,278 | $110,000 | $33,000 | $77,000 |
Source: Public Records
Map
Nearby Homes
- 3121 Coolidge Ave
- 3137 Pleitner Ave
- 2883 Brookdale Ave
- 3134 Pleitner Ave
- 3200 Brookdale Ave
- 2639 Harold St
- 3236 Bona St
- 3220 Champion St
- 3226 Champion St
- 2628 School St
- 3156 Texas St
- 2550 Pleasant St
- 3425 Wilson Ave
- 3114 Suter St
- 3234 E 27th St
- 3140 E 27th St
- 2900 Sheffield Ave
- 2672 Fruitvale Ave
- 3464 Champion St
- 2257 Macarthur Blvd
- 3151 Cuthbert Ave Unit 2
- 3149 Cuthbert Ave Unit 1
- 3153 Cuthbert Ave
- 3145 Cuthbert Ave
- 3161 Cuthbert Ave
- 2931 Schyler St
- 3134 Cuthbert Ave
- 2923 Schyler St
- 3137 Cuthbert Ave
- 2930 Schyler St
- 3144 Cuthbert Ave
- 3142 Cuthbert Ave
- 3146 Cuthbert Ave
- 3138 Cuthbert Ave
- 2919 Schyler St
- 3150 Cuthbert Ave
- 2954 Schyler St
- 3131 Cuthbert Ave
- 3129 Cuthbert Ave
- 3127 Cuthbert Ave
Your Personal Tour Guide
Ask me questions while you tour the home.