3155 The Narrows Dr SW Alexandria, MN 56308
Estimated Value: $439,000 - $509,472
3
Beds
3
Baths
1,672
Sq Ft
$280/Sq Ft
Est. Value
About This Home
This home is located at 3155 The Narrows Dr SW, Alexandria, MN 56308 and is currently estimated at $467,368, approximately $279 per square foot. 3155 The Narrows Dr SW is a home located in Douglas County with nearby schools including Lincoln Elementary School, Discovery Middle School, and Alexandria Area High School.
Ownership History
Date
Name
Owned For
Owner Type
Purchase Details
Closed on
Dec 22, 2021
Sold by
Stromswold Mark A and Stromswold Linda M
Bought by
Monroe Dylan John and Monroe Kelly Floyce
Current Estimated Value
Purchase Details
Closed on
Jun 24, 2016
Sold by
Great River Energy
Bought by
Monroe Dylan John and Monroe Kelly Floyce
Home Financials for this Owner
Home Financials are based on the most recent Mortgage that was taken out on this home.
Original Mortgage
$207,100
Interest Rate
3.57%
Mortgage Type
New Conventional
Purchase Details
Closed on
Sep 21, 2012
Sold by
Worman Raedena
Bought by
Great River Energy and Allete Inc
Purchase Details
Closed on
Jul 27, 2010
Sold by
Englund Ray C
Bought by
Englund Ray C and Ray C Englund Trust
Create a Home Valuation Report for This Property
The Home Valuation Report is an in-depth analysis detailing your home's value as well as a comparison with similar homes in the area
Home Values in the Area
Average Home Value in this Area
Purchase History
| Date | Buyer | Sale Price | Title Company |
|---|---|---|---|
| Monroe Dylan John | -- | None Available | |
| Monroe Dylan John | $218,000 | Attorney | |
| Great River Energy | $435,000 | None Available | |
| Englund Ray C | -- | None Available |
Source: Public Records
Mortgage History
| Date | Status | Borrower | Loan Amount |
|---|---|---|---|
| Previous Owner | Monroe Dylan John | $207,100 |
Source: Public Records
Tax History Compared to Growth
Tax History
| Year | Tax Paid | Tax Assessment Tax Assessment Total Assessment is a certain percentage of the fair market value that is determined by local assessors to be the total taxable value of land and additions on the property. | Land | Improvement |
|---|---|---|---|---|
| 2025 | $3,252 | $437,200 | $290,000 | $147,200 |
| 2024 | $3,252 | $408,500 | $264,500 | $144,000 |
| 2023 | $3,182 | $370,900 | $240,400 | $130,500 |
| 2022 | $2,564 | $344,800 | $224,800 | $120,000 |
| 2021 | $2,556 | $279,500 | $210,400 | $69,100 |
| 2020 | $2,598 | $269,700 | $203,800 | $65,900 |
| 2019 | $2,406 | $267,400 | $203,800 | $63,600 |
| 2018 | $2,340 | $256,500 | $195,300 | $61,200 |
| 2017 | $4,564 | $251,300 | $195,300 | $56,000 |
| 2016 | $4,924 | $452,990 | $318,839 | $134,151 |
| 2015 | $5,524 | $0 | $0 | $0 |
| 2014 | -- | $477,200 | $344,800 | $132,400 |
Source: Public Records
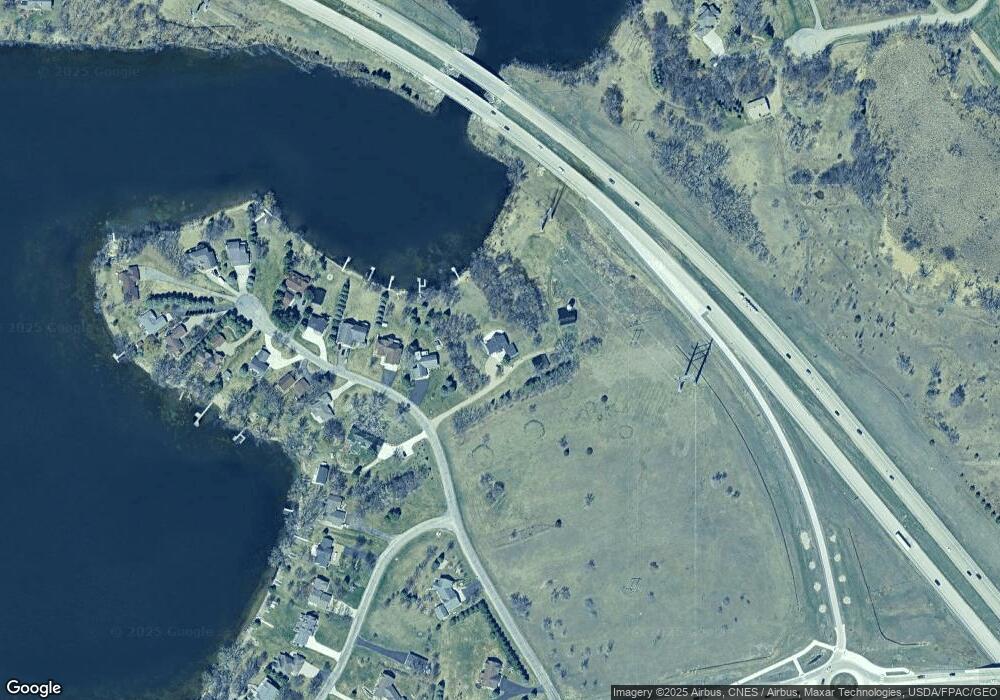
Map
Nearby Homes
- 2402 Reeds Villa Rd SW
- 4760 Country Shores SW
- TBD Nevada St SW
- Lot 5 B4 Brittney's Place
- 1346 Faith Hill Dr
- Lot 7 B4 Brittney's Place
- Lot 1 B2 Dixie Ln
- xxx 34th Ave W
- xx 34th Ave W
- TBD 34th Ave W
- 550 Eldo Ln SW
- 2025 42nd Ave W
- Lot 9 Latoka Heights Ln SW
- Lot 7 Latoka Heights Ln SW
- Lot 8 Latoka Heights Ln SW
- 1205 Melvina Rd SW
- 1626 Melvina Ln SW
- TBD NW Sundance Cir NW
- xxxx Woodsmen Ln SW
- 2361 Highland Trail SW
- 3075 The Narrows Dr SW
- 3061 The Narrows Dr SW
- 3033 The Narrows Dr SW
- 3100 The Narrows Dr SW
- 2903 The Narrows Dr SW
- 3050 The Narrows Dr SW
- 3344 Latoka Bay Rd SW
- 3002 The Narrows Dr SW
- 3002 The Narrows Dr SW
- 3282 Narrows Dr SW
- 2902 The Narrows Dr SW
- 3282 Narrows Dr SW
- 3350 Latoka Bay Rd SW
- 2809 The Narrows Dr SW
- 2880 The Narrows Dr SW
- 3366 Latoka Bay Rd SW
- 2807 The Narrows Dr SW
- 2824 The Narrows Dr SW
- 3378 Narrows Dr SW
- 3374 Latoka Bay Rd SW